
Geoinformation
Services Based on
EO Data
Satellite monitoring of flooding, deformation,
environmental change, and maritime conditions
Provision of
Radar Data
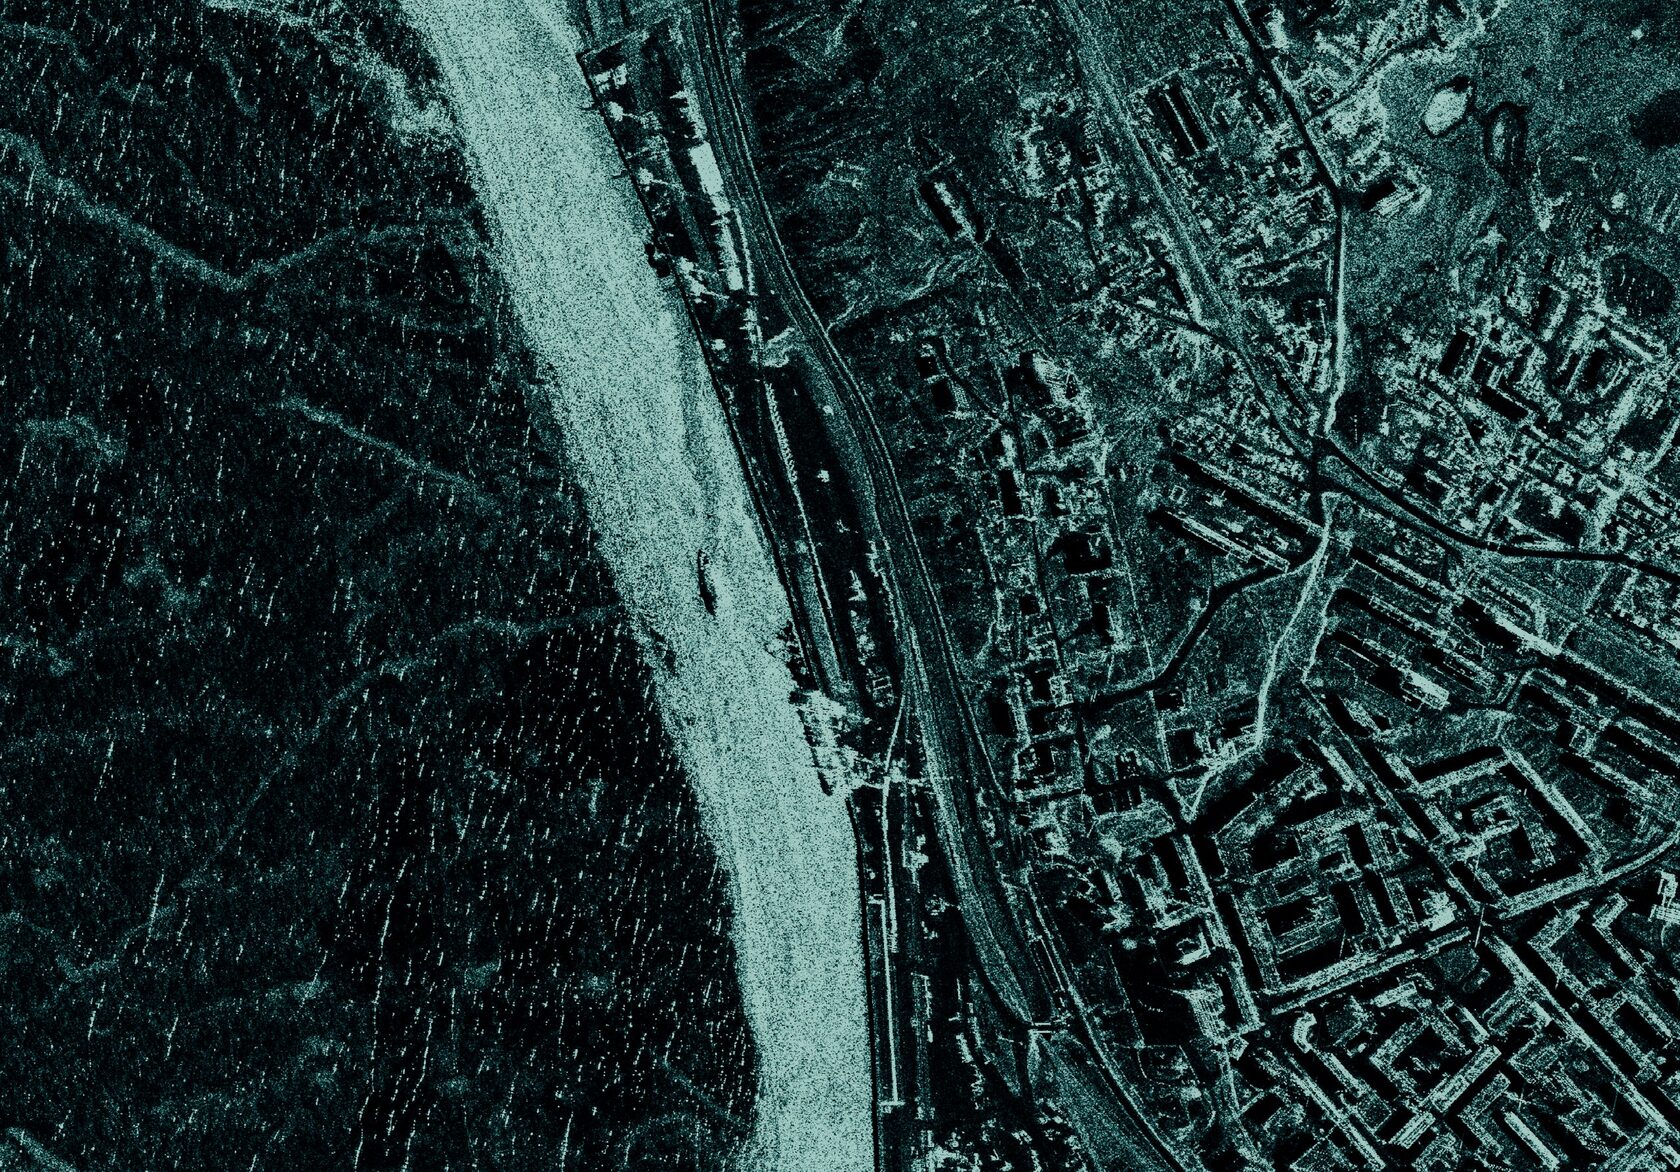
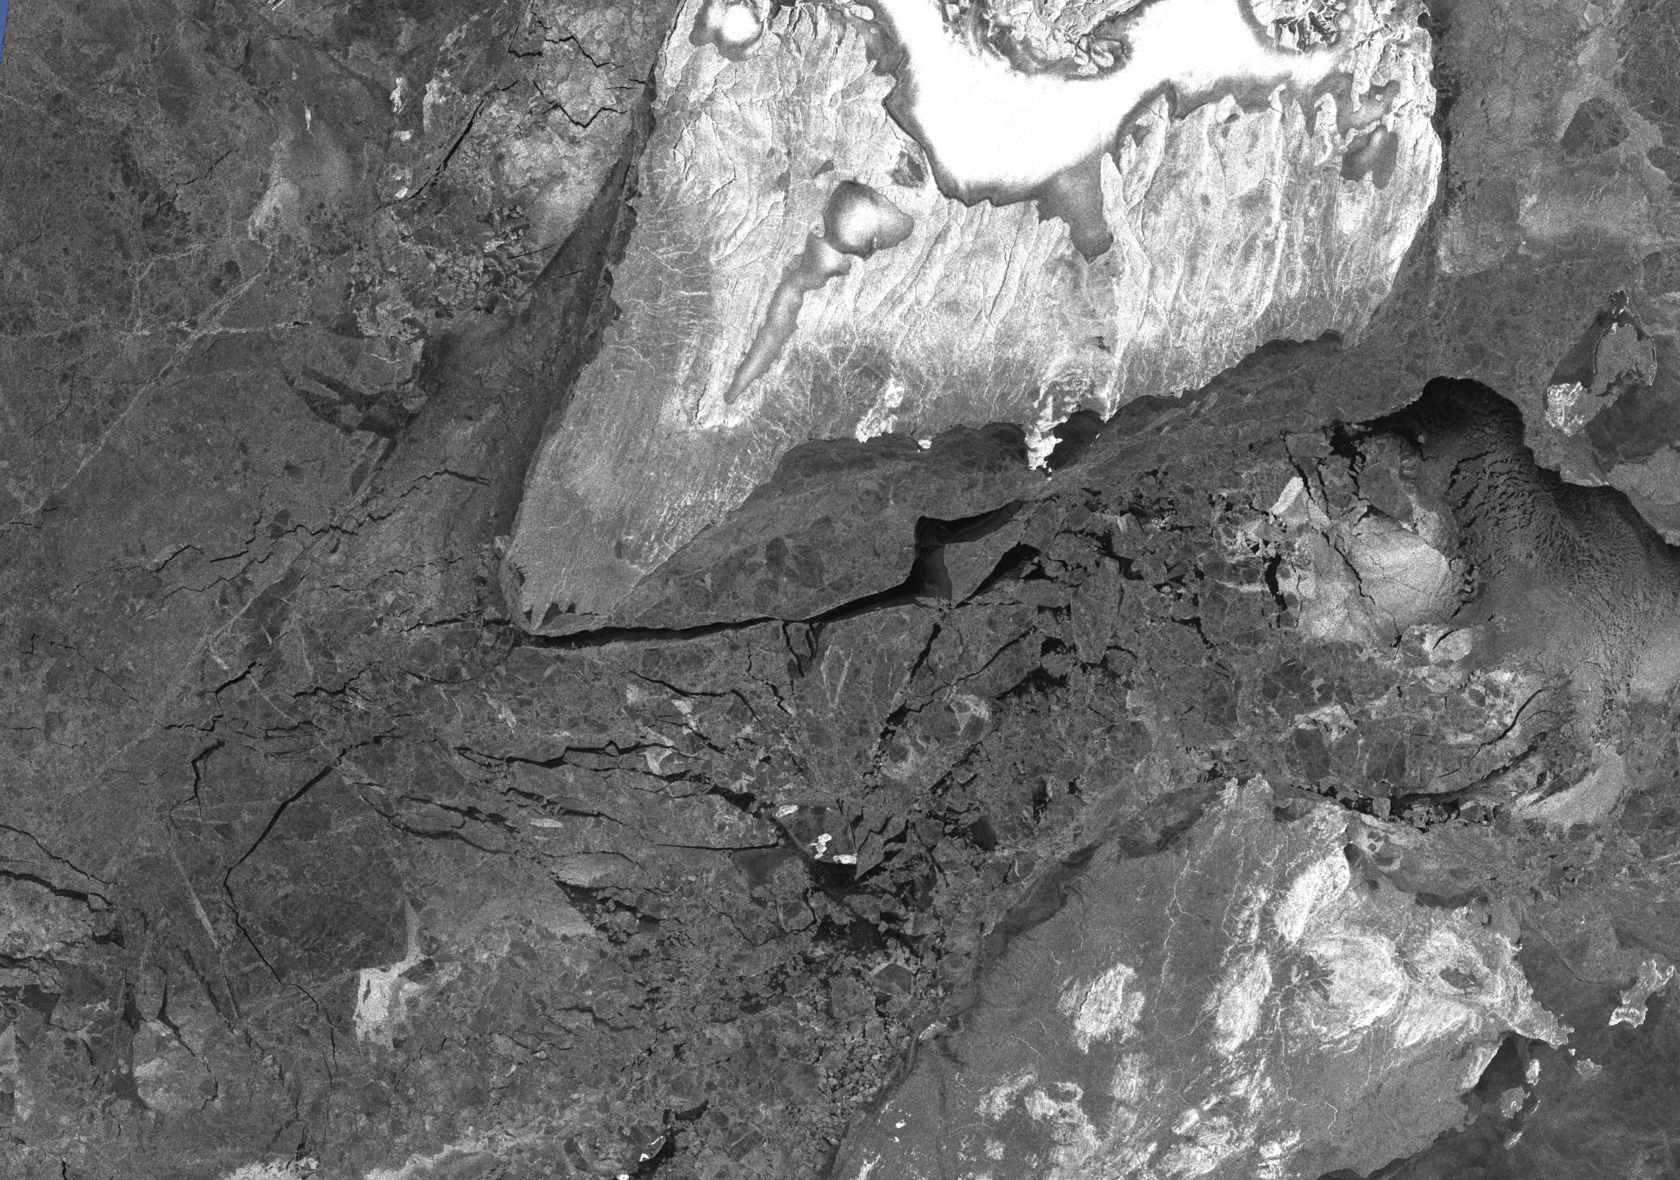
All-weather SAR imaging from space:
planning, acquisition, and delivery of data for monitoring land areas and waters.
turnaround
| Mode | Scene, km | Resolution, m | Incidence angle, ° | Cost per 1 sq. m, thousand RUB | Application |
|---|---|---|---|---|---|
| Spotlight | 7 × 7 | 1.5 | 15–39 | 3300 | Detailed imaging of local objects and infrastructure |
| StripMap | 25 × 25 | 3.0 × 3.0 | 15–39 | 259 | Extended routes, pipelines |
| ScanSAR NS | 100 × 100 | 12.0 × 12.0 | 15–39 | 16 | Monitoring of water areas |
| ScanSAR ES | 170 × 170 | 20.0 × 20.0 | 15–39 | 6 | Wide coverage, ice reconnaissance |
| ScanSAR TopSAR | 100 × 100 | 10.0 × 10.0 | 15–39 | 19 | Interferometry, deformation |
- agreeing on areas of interest and monitoring priorities
- planning space imaging and coordinating spacecraft operators
- verifying data receipt after imaging is completed
- arranging data delivery and providing advisory support
Services Based on EO Data
Tailored to Your Task
We select EO data, configure processing,
and deliver the result as maps, analytics, and a report.
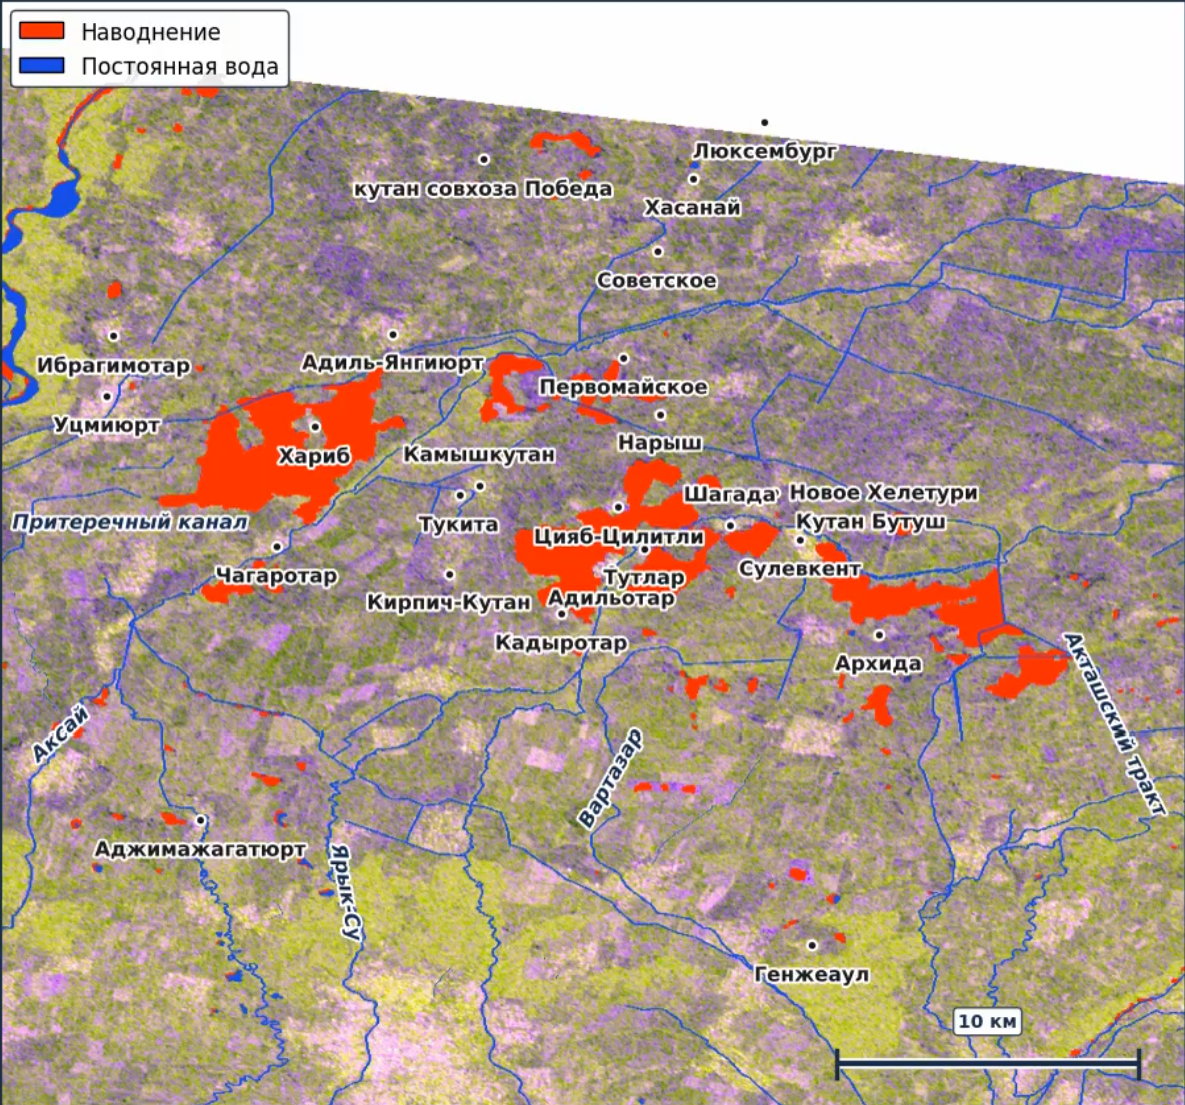
Flood
Monitoring
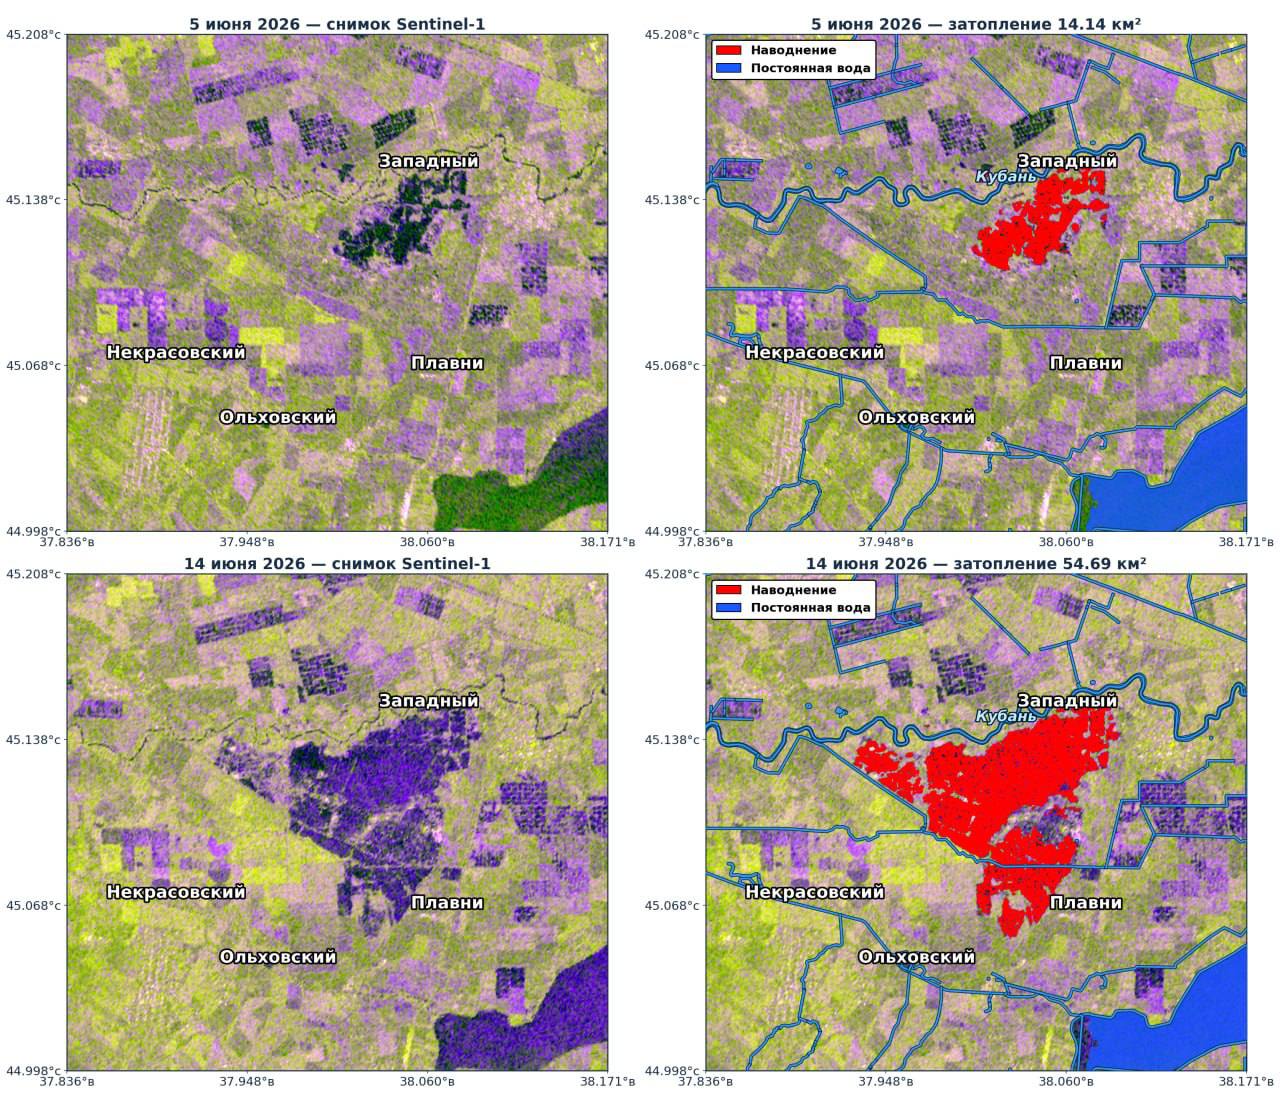
A service for rapid detection of flooding, estimation of flooded area,
and tracking of flood dynamics from satellite radar data.
to automatically outline water surfaces. Flooded areas are identified
using a consensus of an ensemble of neural network models,
which reduces false positives and improves the robustness of the result.
- Detection of flooded zones in open areas, floodplains, and farmland
- Outlines of flooded areas and area calculation by imaging date
- Assessment of how the flood is advancing or receding
- A flood zone map produced by a consensus segmentation algorithm
- A concise analytical report with areas, dynamics, and links to infrastructure
Ground Deformation
Monitoring
Detection of subsidence and ground movement from SBAS and PSI InSAR time series — satellite radar interferometry
on the data
from satellite data
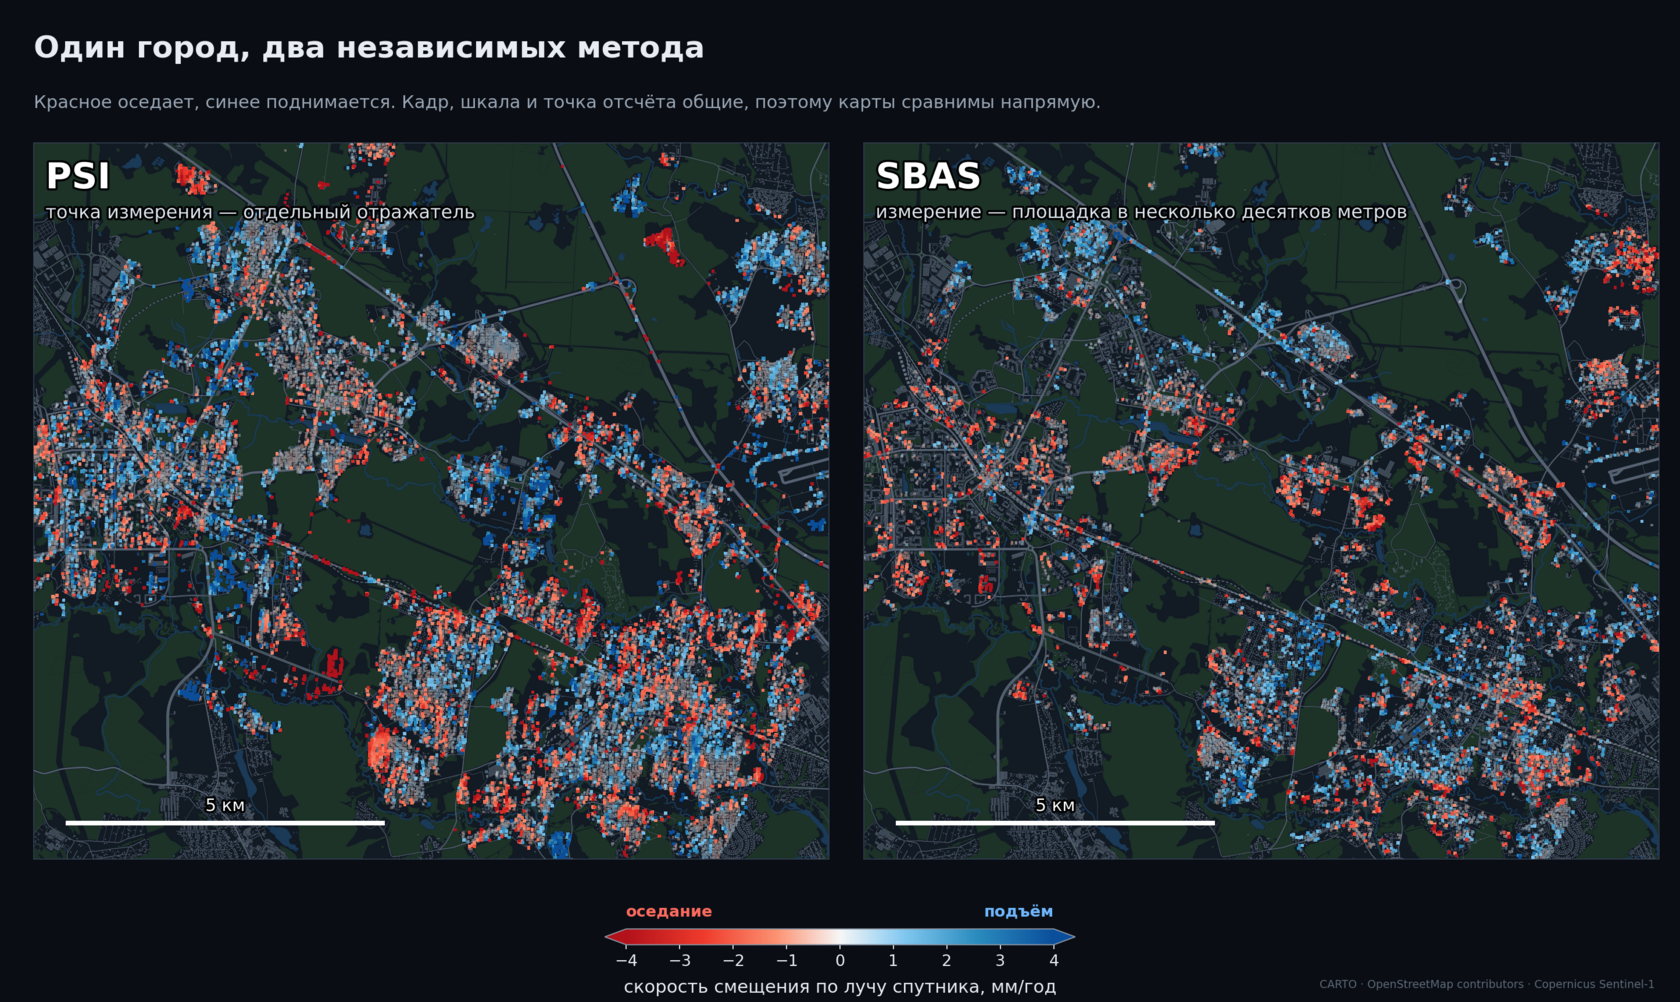
The service detects and tracks millimeter-scale ground displacements: subsidence, uplift, and unstable zones. Calculation is done with two independent methods — PSI (the measurement point is an individual reflector) and SBAS (the measurement covers an area of several tens of meters).
| Satellite | Sentinel-1 (C-band, λ = 5.5 cm) |
| Processing method | SBAS and PSI |
| Measured quantity | Displacement rate along the satellite line of sight (LOS) |
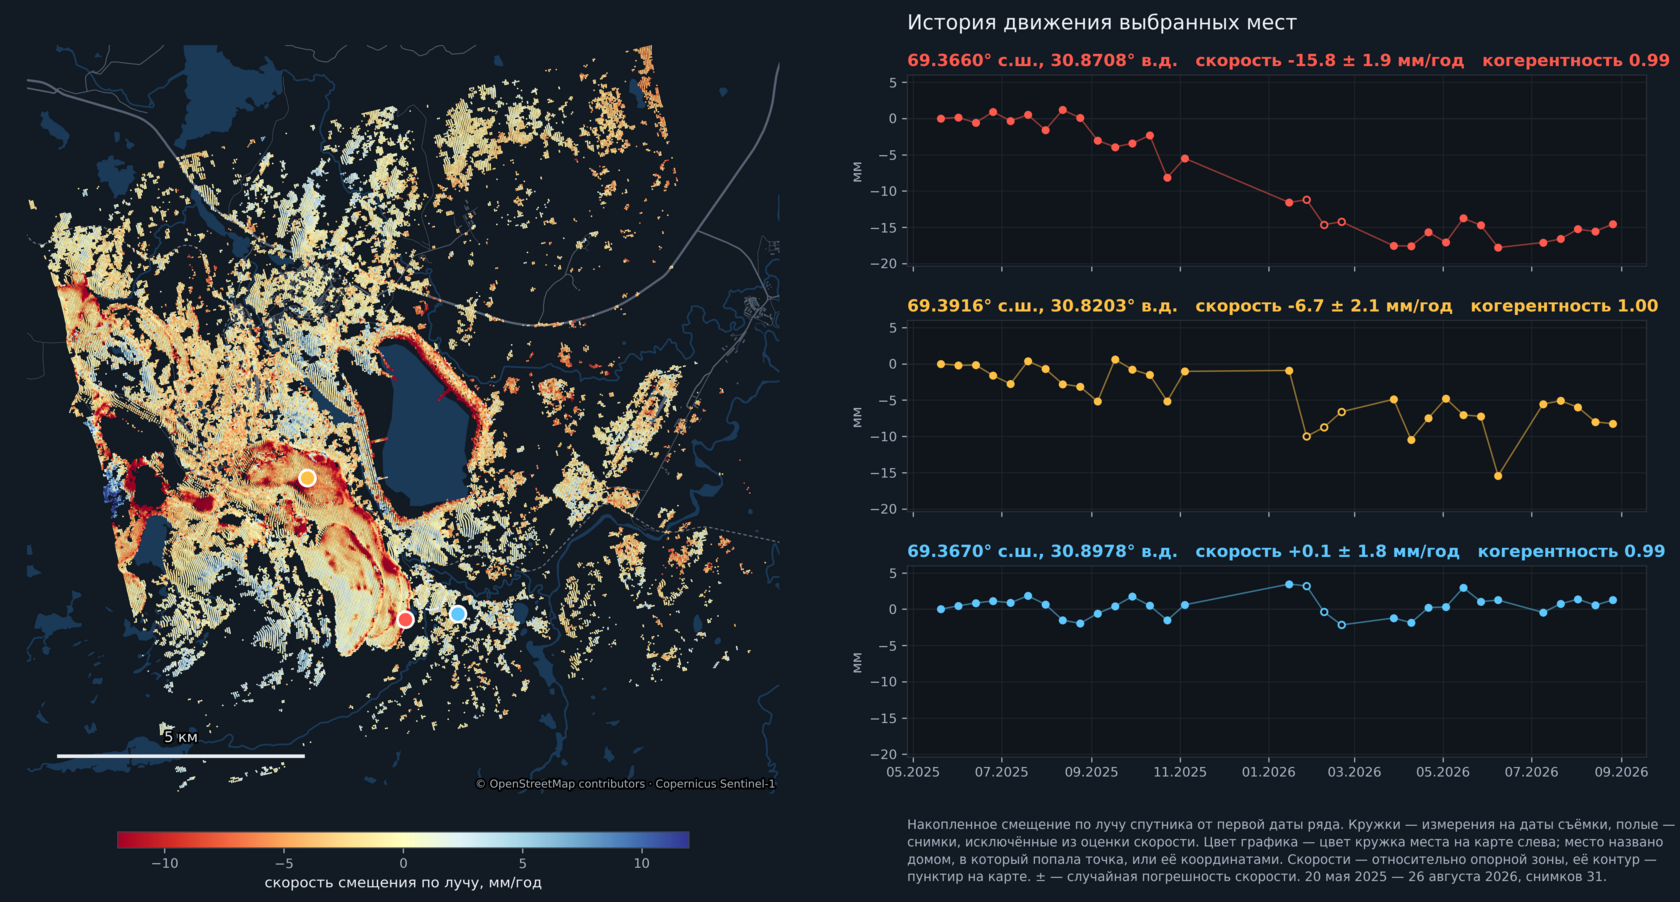
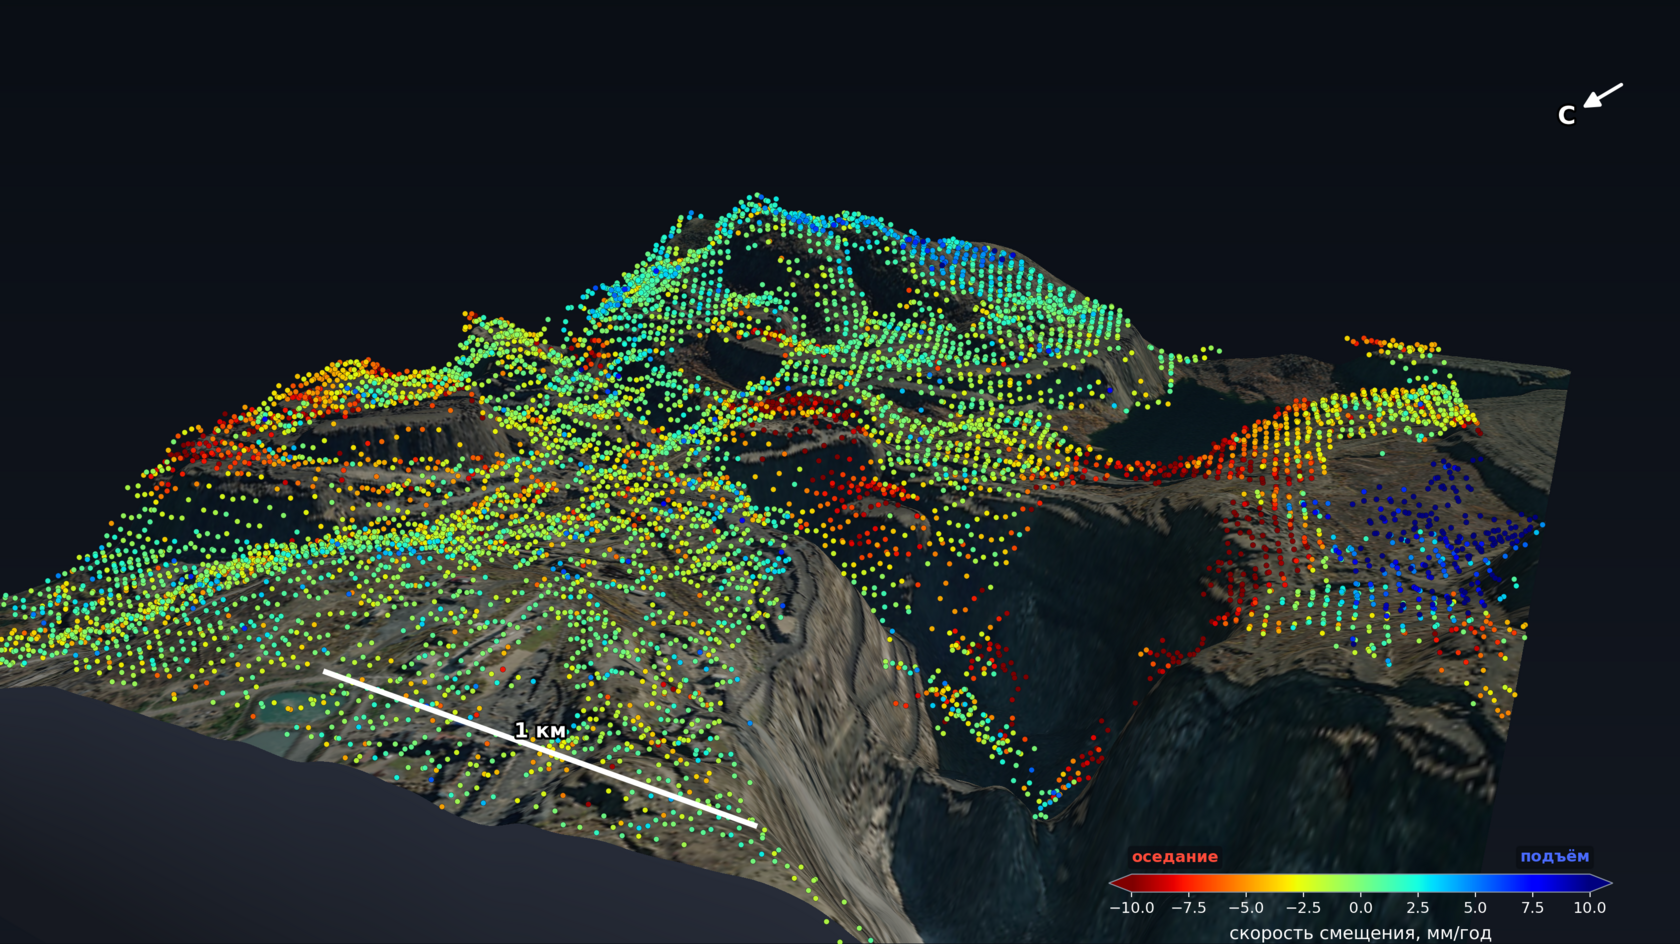
| Analyzed area | the city of Zelenograd, the Zapolyarny open pit |
- A velocity map of the entire site: PSI, SBAS, or both methods, georeferenced for loading into GIS
- A motion time series for every point and object: not only “how many mm per year” but also how it accumulated over imaging dates
- Objects, not pixels: a register of buildings or zones with addresses, areas, velocities, and uncertainties
- Direction of motion, not just magnitude — where two orbits are available: vertical and horizontal components separately
- Automatic detection of moving zones, with an assessment of whether the process is accelerating and an indication of where data is insufficient
- History going back: time series from the imaging archive, without a single site visit
- Recalculation as new images arrive
- Fast displacements (tens of centimeters between acquisitions) — a separate methodology currently under development at the company
Deformation: Results on Real Sites
Two pilot calculations from the Sentinel-1 radar imagery archive — an industrial site and urban development. No site visits.
Case 01: Zapolyarny open pit — 60,000 measurements across the pit, spoil heaps, and surrounding area
Case 02: Zelenograd — a block where almost all buildings are sinking
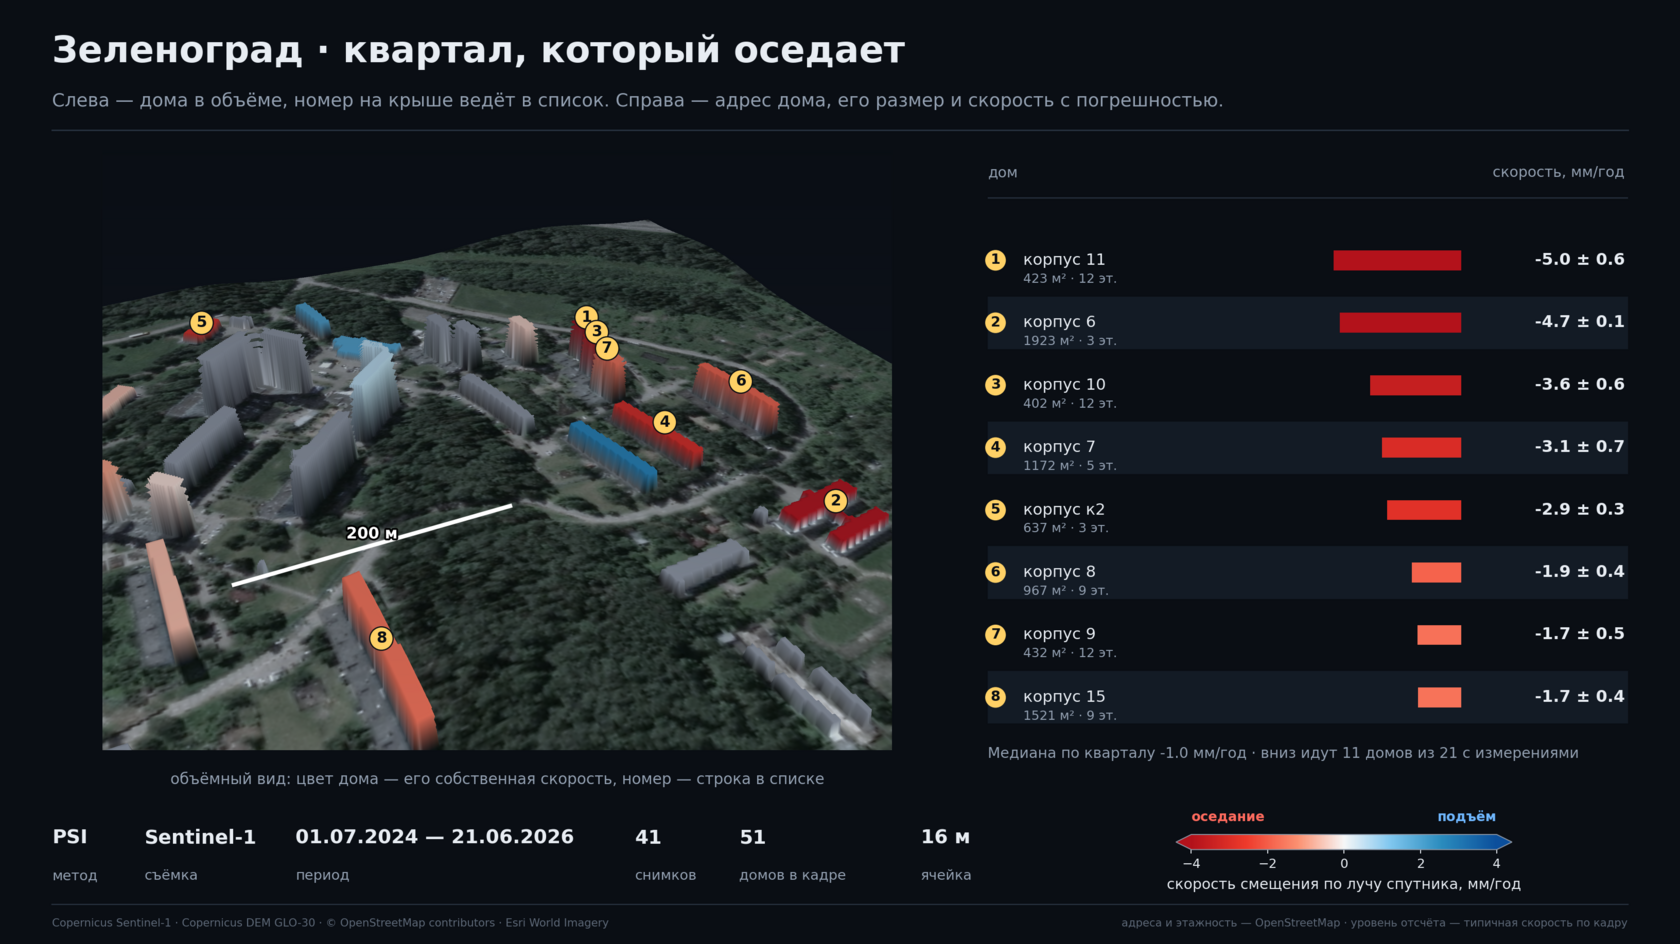
Block summary: median −1.0 mm/year; 11 of the 21 buildings with measurements are sinking. Everything was calculated from the Sentinel-1 radar imagery archive over two years — 41 images, 51 buildings in the frame, 16 m cell, period 1 July 2024 – 21 June 2026. No site visits.
Environmental
Monitoring of Territories
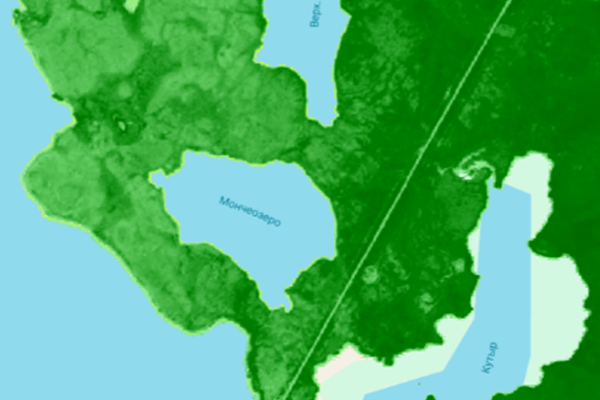
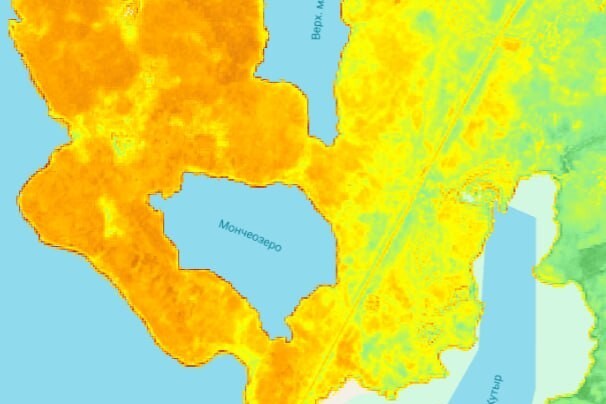
Assessment of the condition of natural and industrial areas using multispectral
satellite data and indices tailored to the customer’s task.
degradation, bare soil, minerals, water bodies, and surface temperature.
Retrospective series, change maps, regressions, and anomalies are also produced.
nuclear power plant zones — retrospective assessment of vegetation indices and cooling pond temperatures for 1984–2022.
- Index maps, difference maps, and change dynamics for the area of interest
- Time series, trends, regression analysis, and Z-score anomalies
- Comparison of target sites with background areas and control zones
- Detection of vegetation stress hotspots and moisture and thermal anomalies
- Comparison with ground data, maps, and an analytical report

Arctic
Monitoring
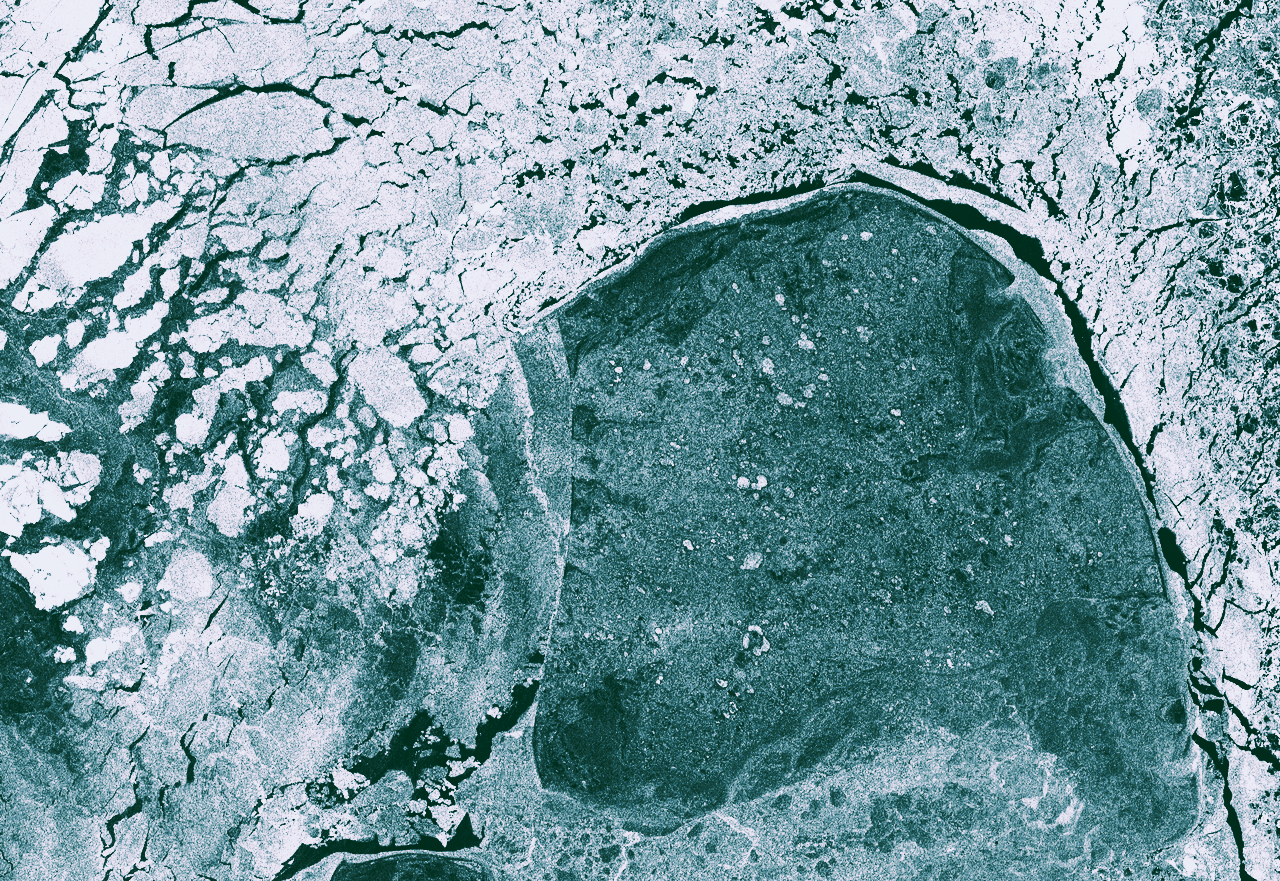
Rapid monitoring of ice and navigation conditions,
vessels, and icebreaker tracks from radar data.
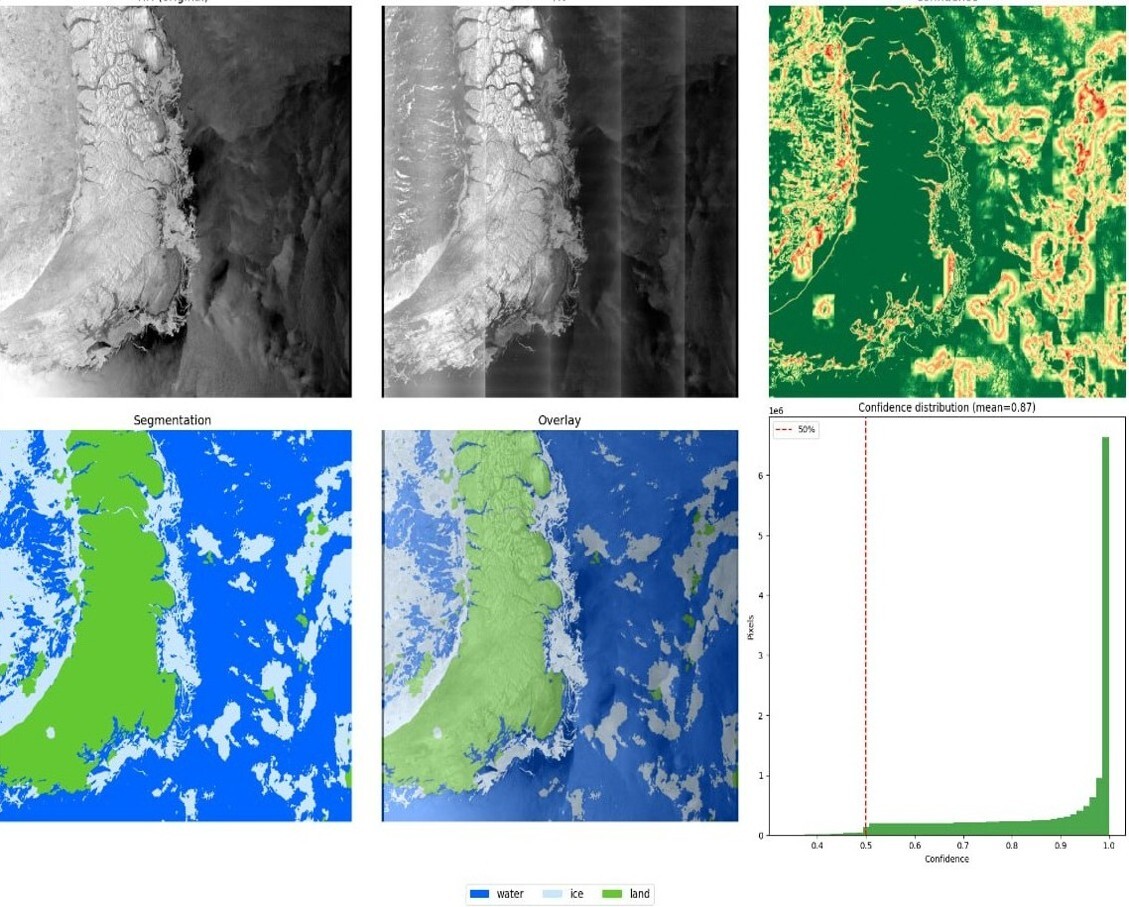
The service is designed for monitoring Arctic waters from radar data.
Processing includes ice condition assessment, separation of water, ice, and land zones, detection of vessels
and maritime infrastructure objects, and track analysis.
| Data | SAR imagery for monitoring water areas |
| Case areas | Arctic seas, ports, approach channels, and routes |
| Tasks | ice conditions, vessels, infrastructure, icebreaker tracks |
| Methods | segmentation, object detection, tracking algorithms |
| Result | situational maps and an analytical report |
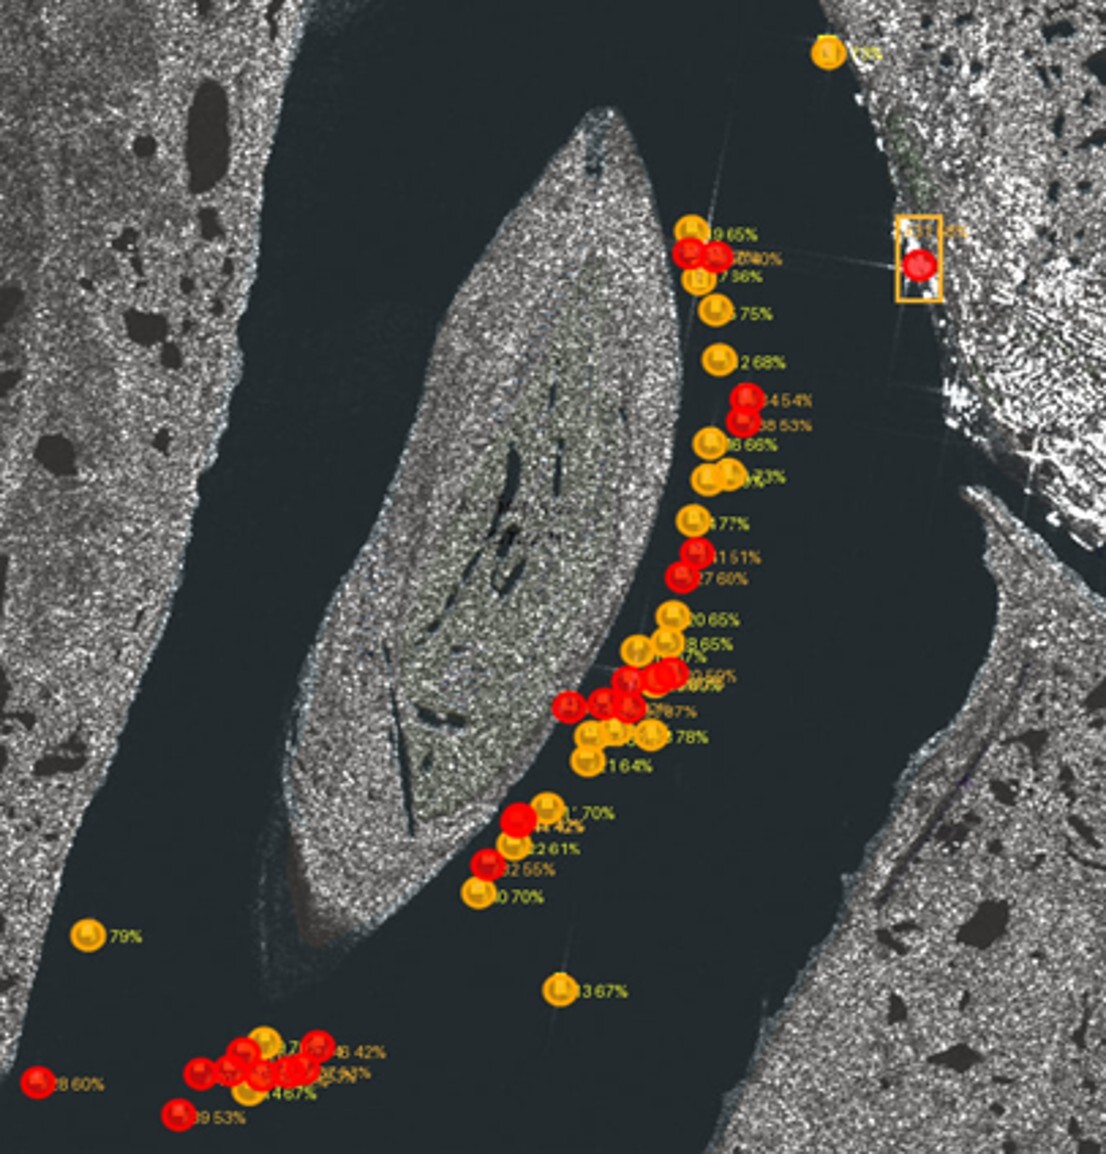
- A map of ice and navigation conditions based on up-to-date SAR data
- Detection of vessels and infrastructure objects in ports and on approaches
- Detection of icebreaker tracks and assessment of route passability
- An analytical report for work planning and shipping safety
Orbital
and Ground Segment
The radar spacecraft provides all-weather, round-the-clock imaging.
The ground segment handles reception, decoding, and processing of data — from the downlink stream to a finished L1/L2 product.
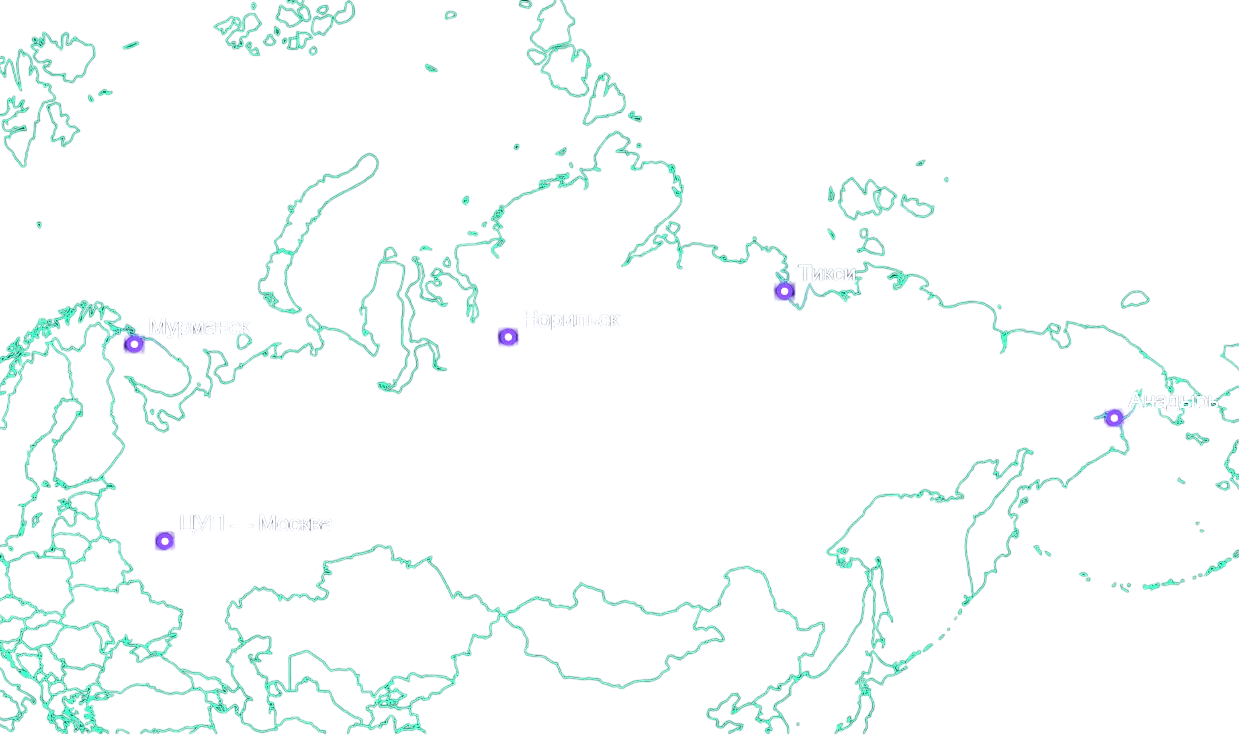
A distributed network of ground receiving stations ensures minimal data delivery latency
for Arctic and hard-to-reach regions.
Let’s discuss your task
and prepare a cost estimate
Tell us about your infrastructure and your task — we will choose the integration format and the data delivery method.