
Geospatial
services based on
Earth observation data
Satellite monitoring of flooding, ground deformation,
environmental changes, and maritime conditions
Provision of
SAR data
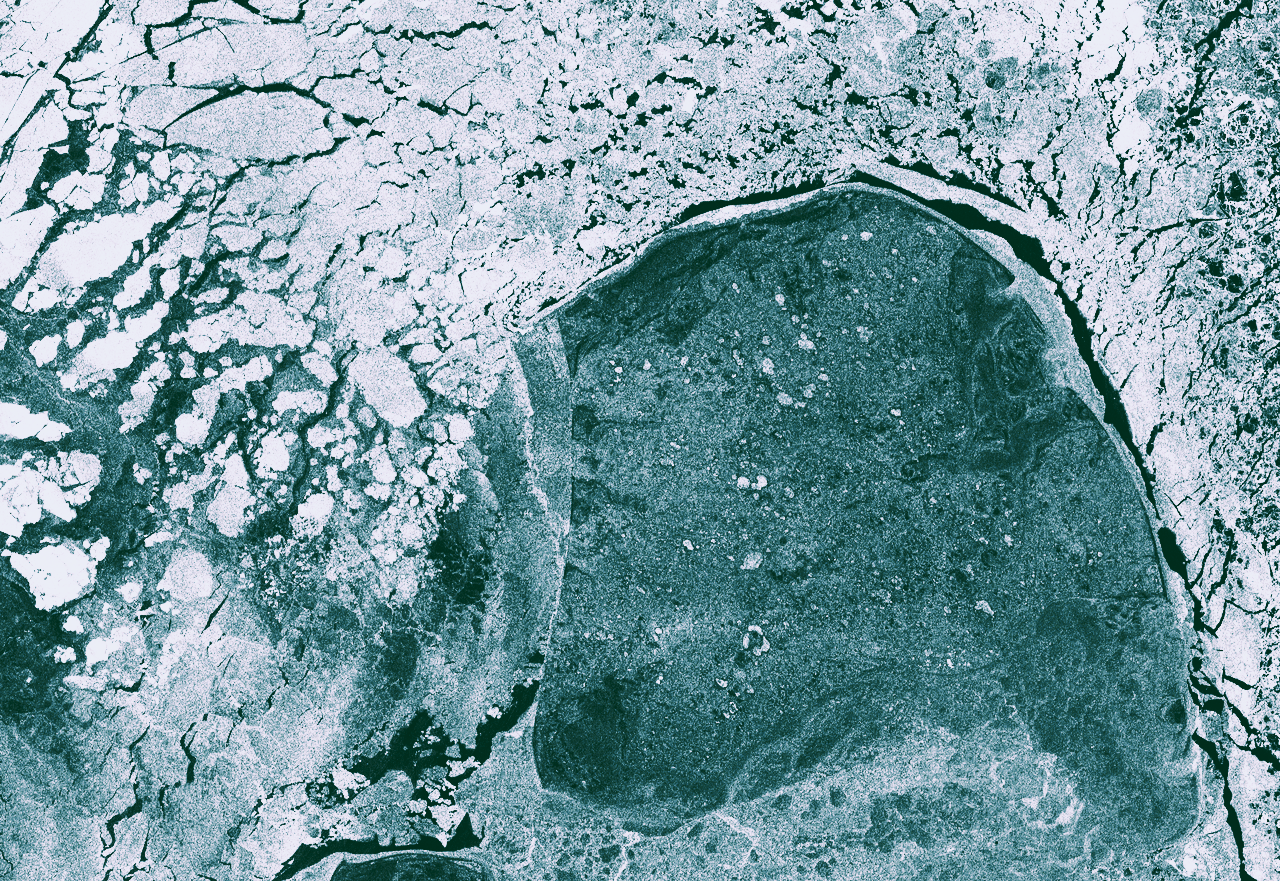
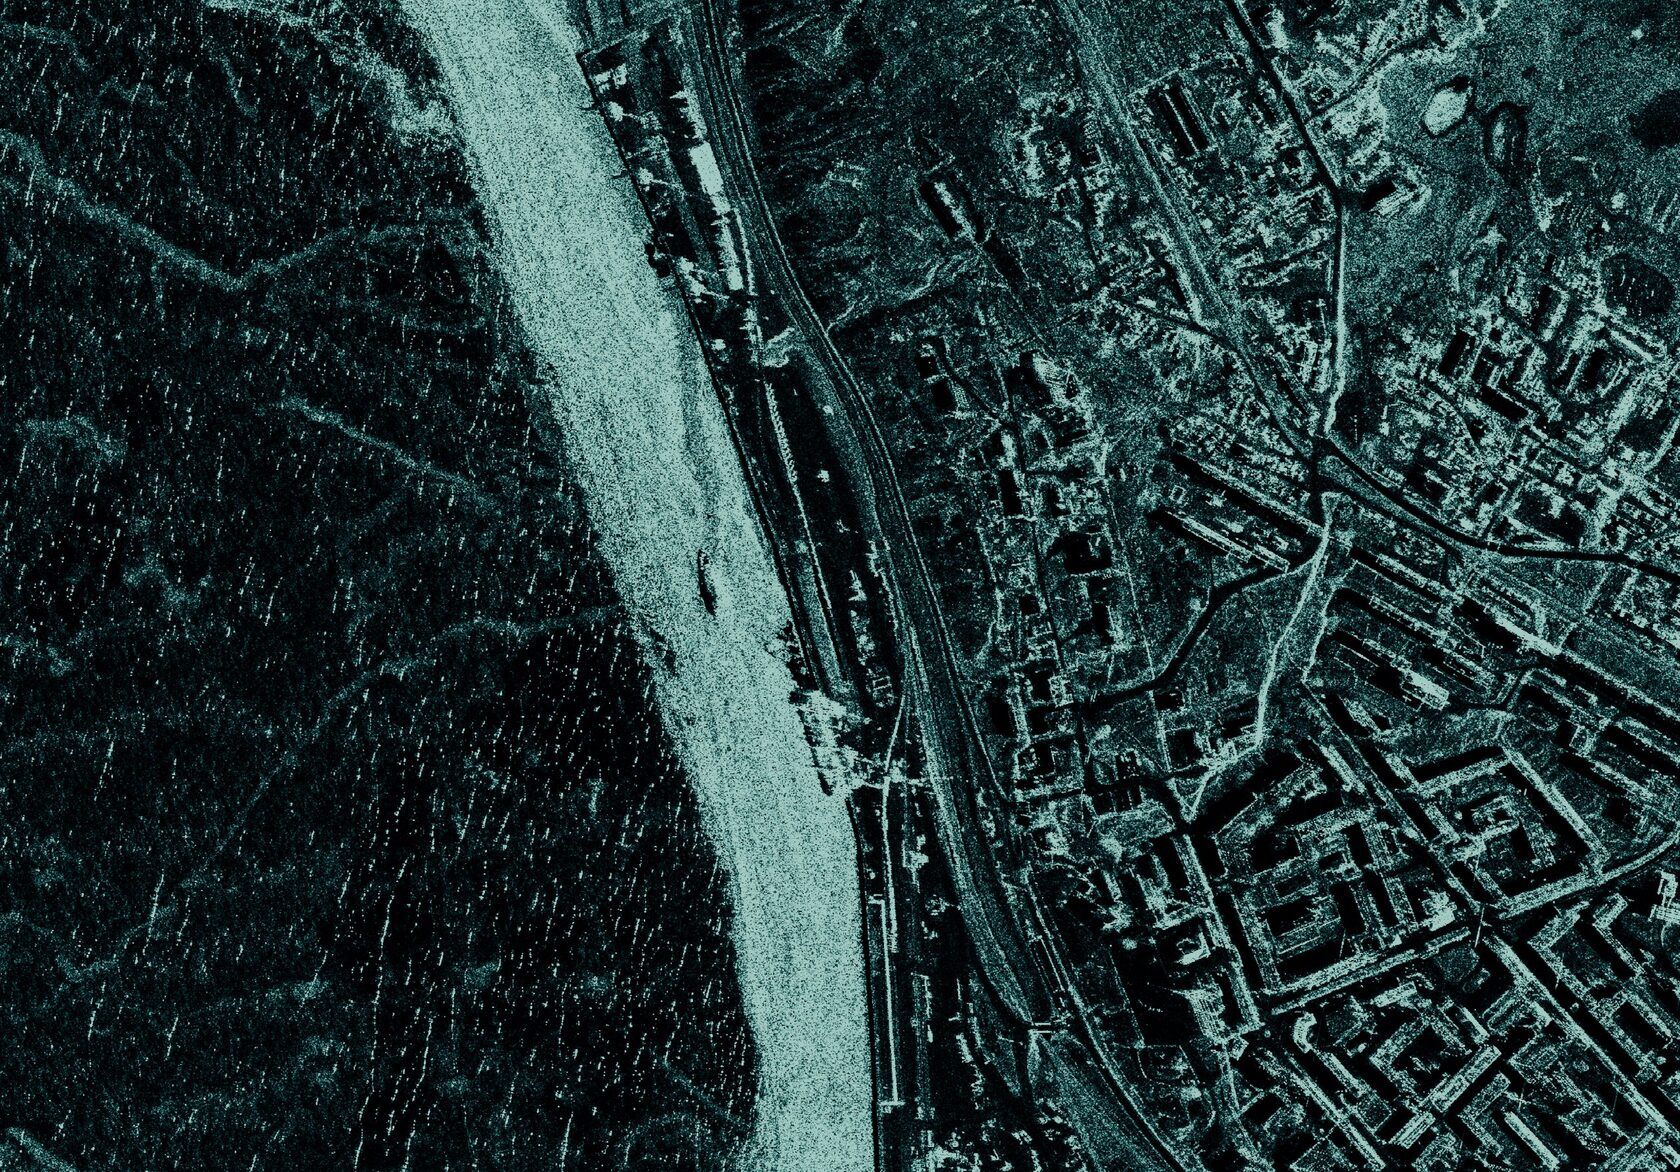
All-weather spaceborne SAR imaging:
planning, acquisition, and delivery of data for monitoring land and maritime areas.
time
| Mode | Scene, km | Resolution, m | Incidence angle, ° | Cost per sq. m, RUB thousand | Application |
|---|---|---|---|---|---|
| Spotlight | 7 × 7 | 1.5 | 15–39 | 3300 | Detailed imaging of local assets and infrastructure |
| StripMap | 25 × 25 | 3.0 × 3.0 | 15–39 | 259 | Linear routes and pipelines |
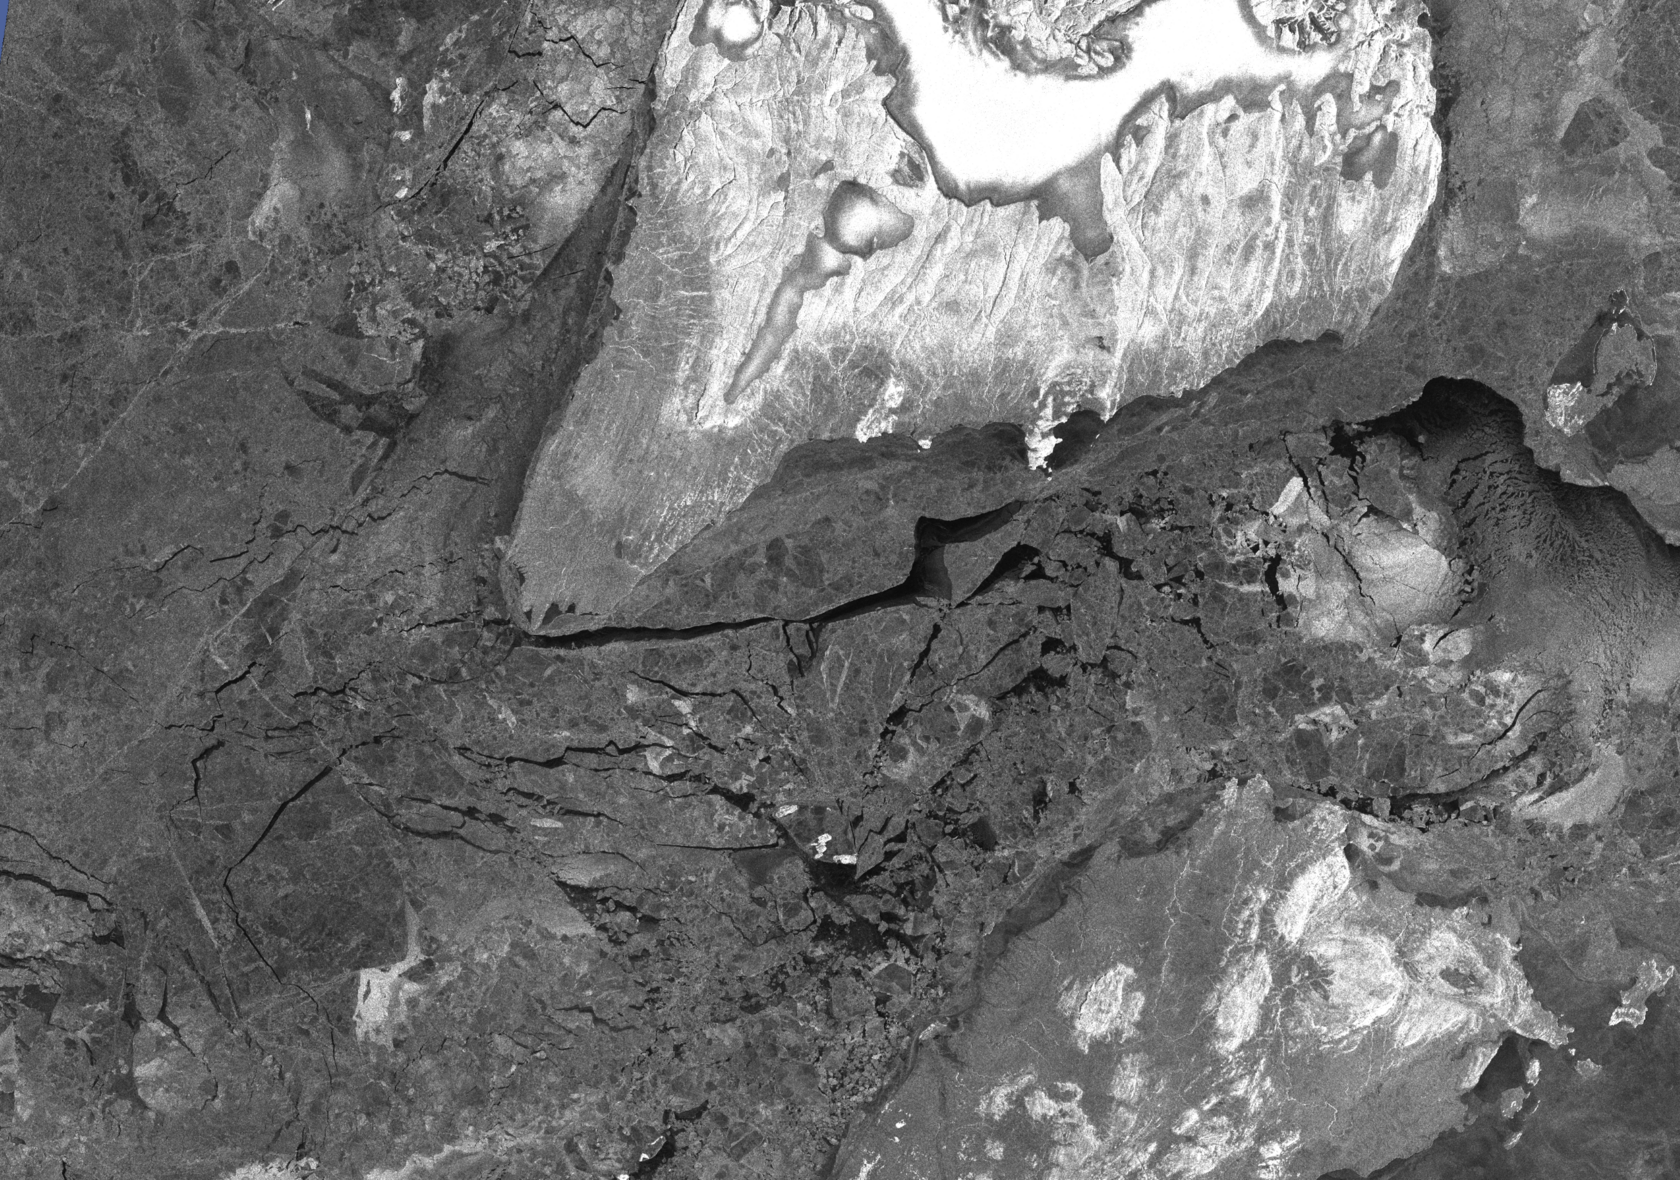
| ScanSAR NS | 100 × 100 | 12.0 × 12.0 | 15–39 | 16 | Monitoring of maritime areas |
| ScanSAR ES | 170 × 170 | 20.0 × 20.0 | 15–39 | 6 | Wide-area coverage and ice reconnaissance |
| ScanSAR TopSAR | 100 × 100 | 10.0 × 10.0 | 15–39 | 19 | Interferometry and deformation monitoring |
- definition of areas of interest and monitoring priorities
- satellite imaging planning and coordination with satellite operators
- verification of data acquisition after imaging
- data transfer arrangements and advisory support
Services based on Earth observation data
tailored to customer needs
We select the right Earth observation data, configure processing,
and deliver the results as maps, analytics, and reports.
Flood
monitoring
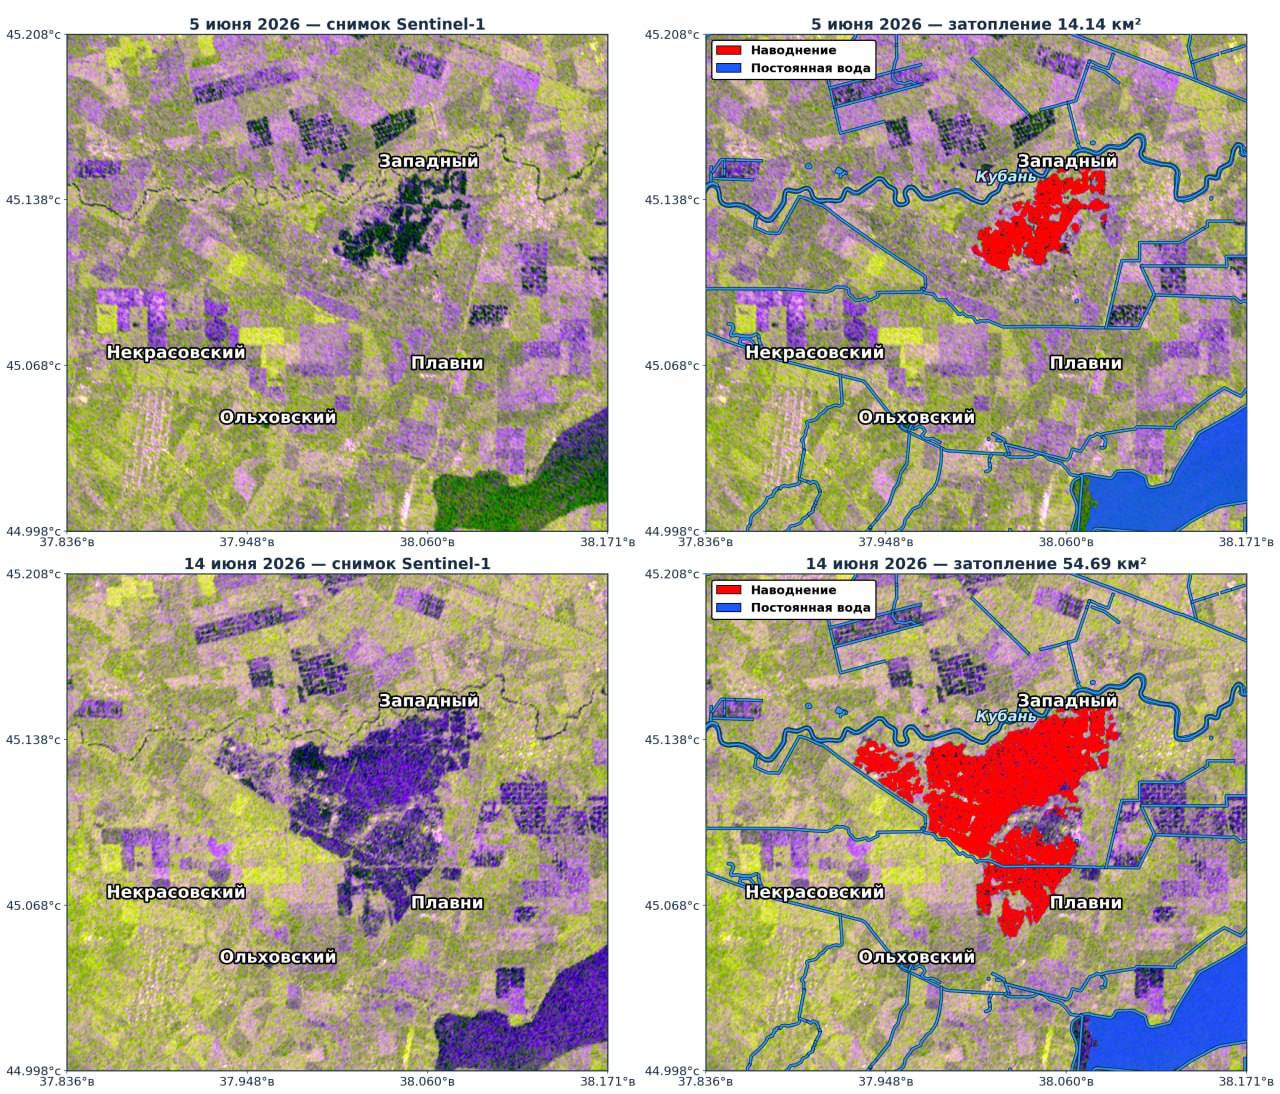
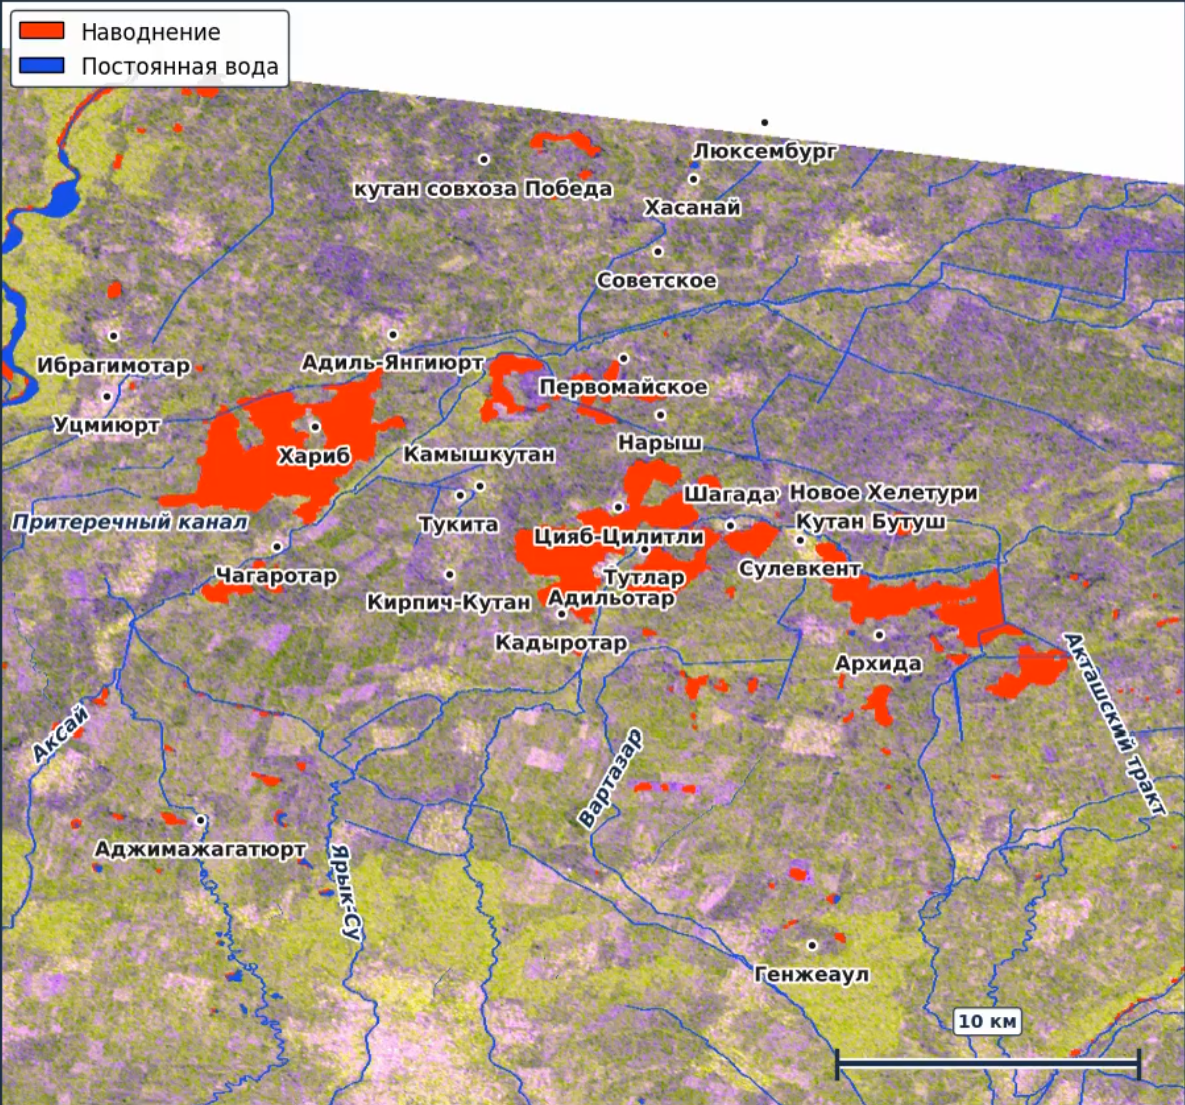
A service for rapid flood detection, assessment of inundated areas,
and monitoring flood dynamics using satellite radar data.
to automatically delineate water surfaces. Flooded areas are identified
using a consensus decision from an ensemble of neural network models,
reducing false detections and improving result robustness.
- Detection of flooded areas across open land, floodplains, and agricultural fields
- Flood extent boundaries and area calculations for each imaging date
- Assessment of flood expansion or recession dynamics
- Flood extent map produced using a consensus segmentation algorithm
- A concise analytical report covering affected areas, dynamics, and nearby infrastructure
Monitoring deformation
of the ground surface
Detection of subsidence and displacement using SBAS InSAR time series—
satellite radar interferometry based on the Small Baseline Subset method.
on the data source
using satellite data
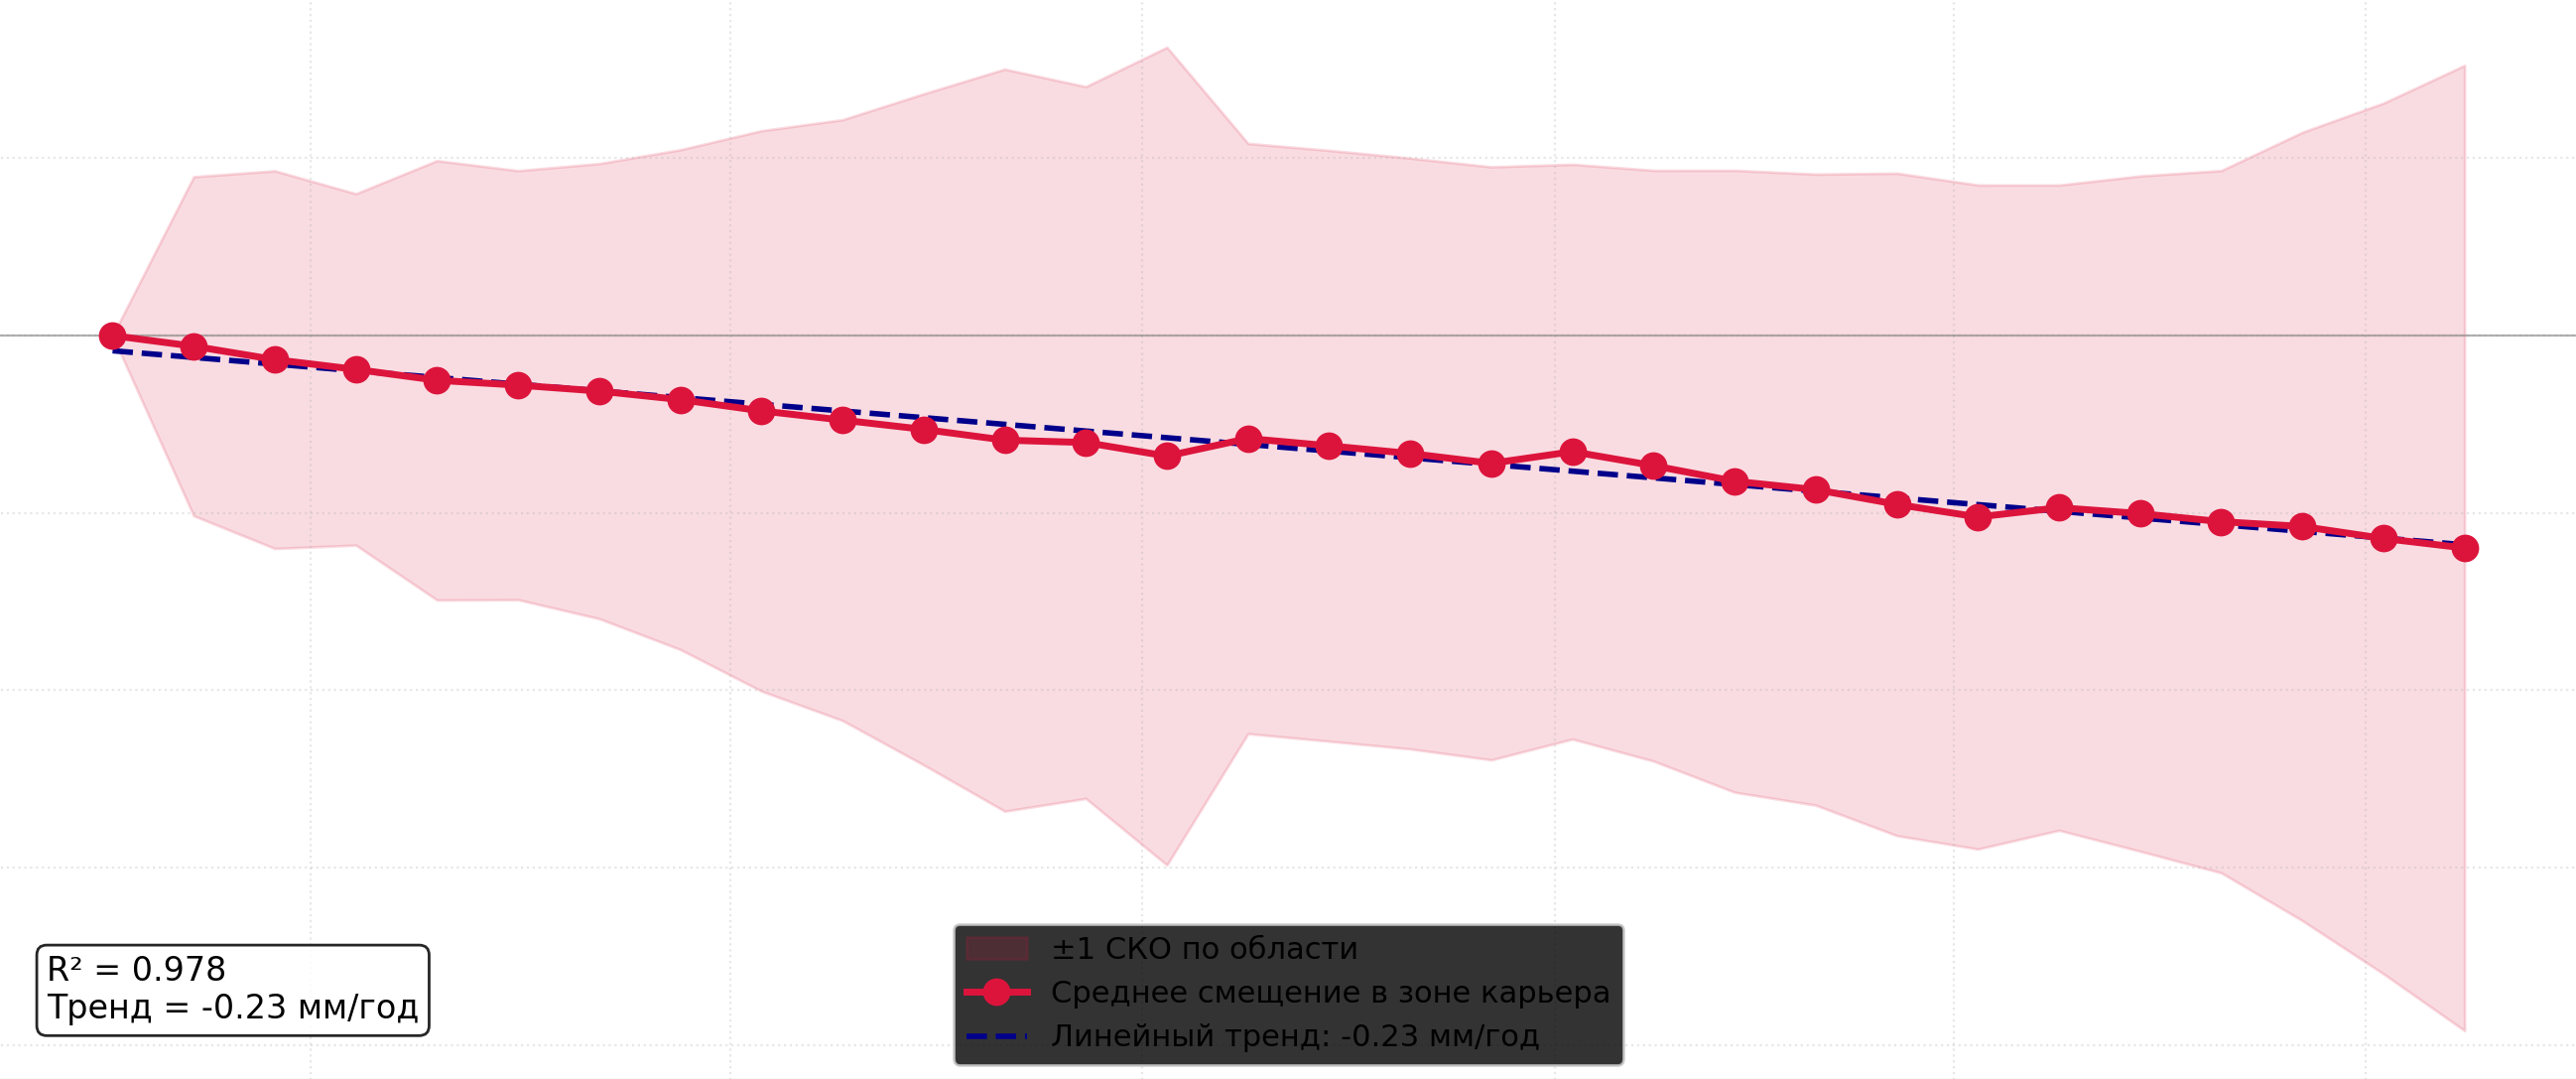
The service detects and monitors
millimetre-scale ground displacement, including subsidence, uplift, and unstable areas.
| Satellite | Sentinel-1 (C-band, λ = 5.5 cm) |
| Pilot analysis period | May 20, 2025–May 20, 2026, 30 acquisitions |
| Processing method | SBAS + phase linking |
| Measured parameter | Displacement velocity along the satellite line of sight (LOS) |
| Area analysed | 8×8 km around the open-pit mine |
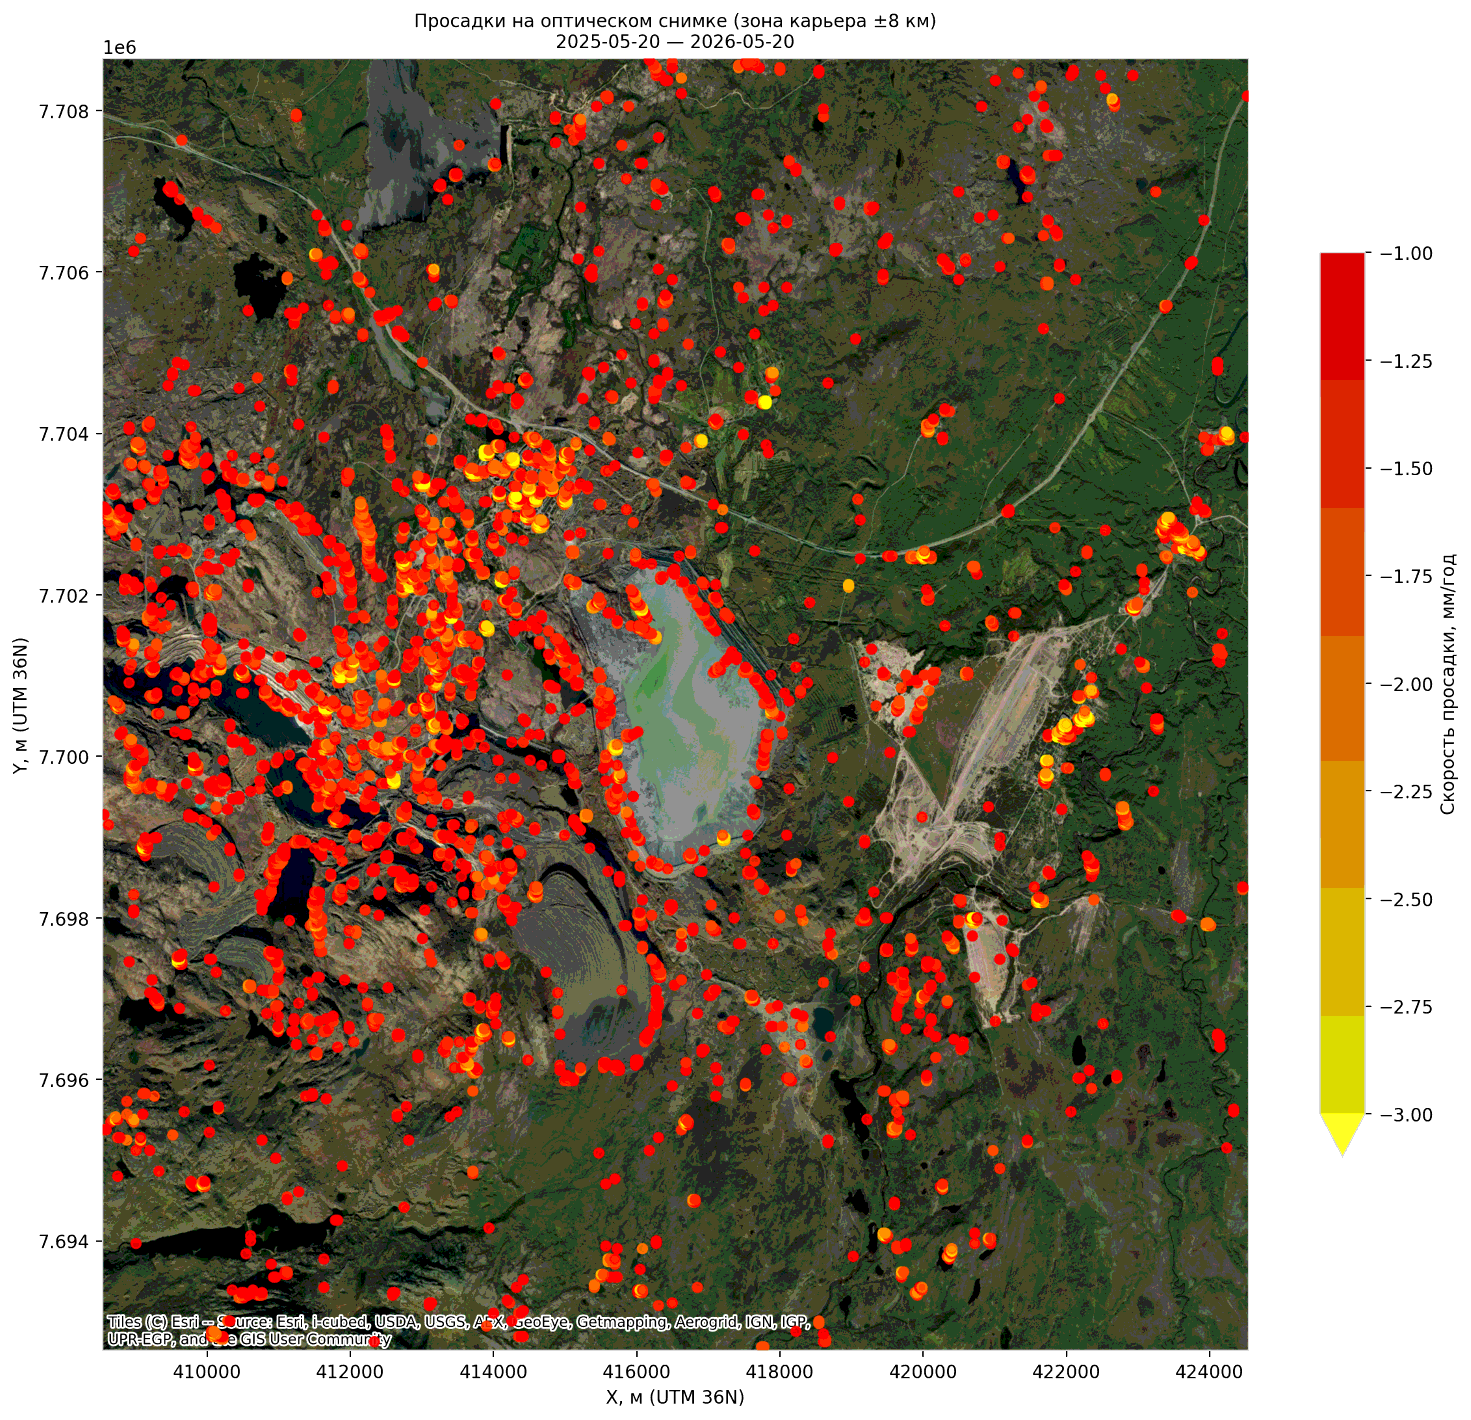
- Surface displacement velocity map in mm/year
- Time series of cumulative displacement across areas of interest
- Locations of subsidence zones on a satellite basemap
- Conclusions on site stability and monitoring recommendations
Environmental
monitoring of land areas
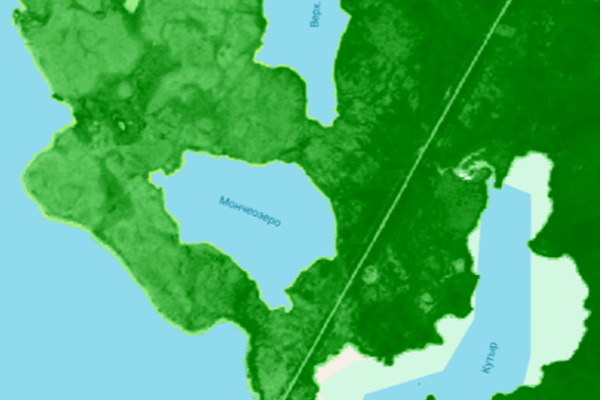
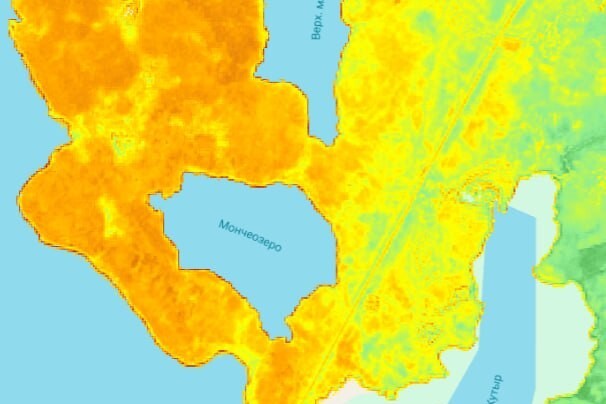
Assessment of natural and industrial areas using multispectral
satellite data and task-specific indices.
degradation, bare-soil, mineral, water-body, and land-surface-temperature indices.
Historical time series, change maps, regression models, and anomaly maps can also be produced.
nuclear power plant sites—historical assessment of vegetation indices and cooling-reservoir temperatures for 1984–2022.
- Index maps, difference maps, and change dynamics across the area of interest
- Time series, trends, regression analysis, and Z-score anomalies
- Comparison of target sites with background and control areas
- Detection of vegetation stress, moisture anomalies, and thermal anomalies
- Comparison with ground observations, maps, and an analytical report

Arctic
monitoring
Operational monitoring of ice and navigation conditions,
vessels, and icebreaker tracks using SAR data.
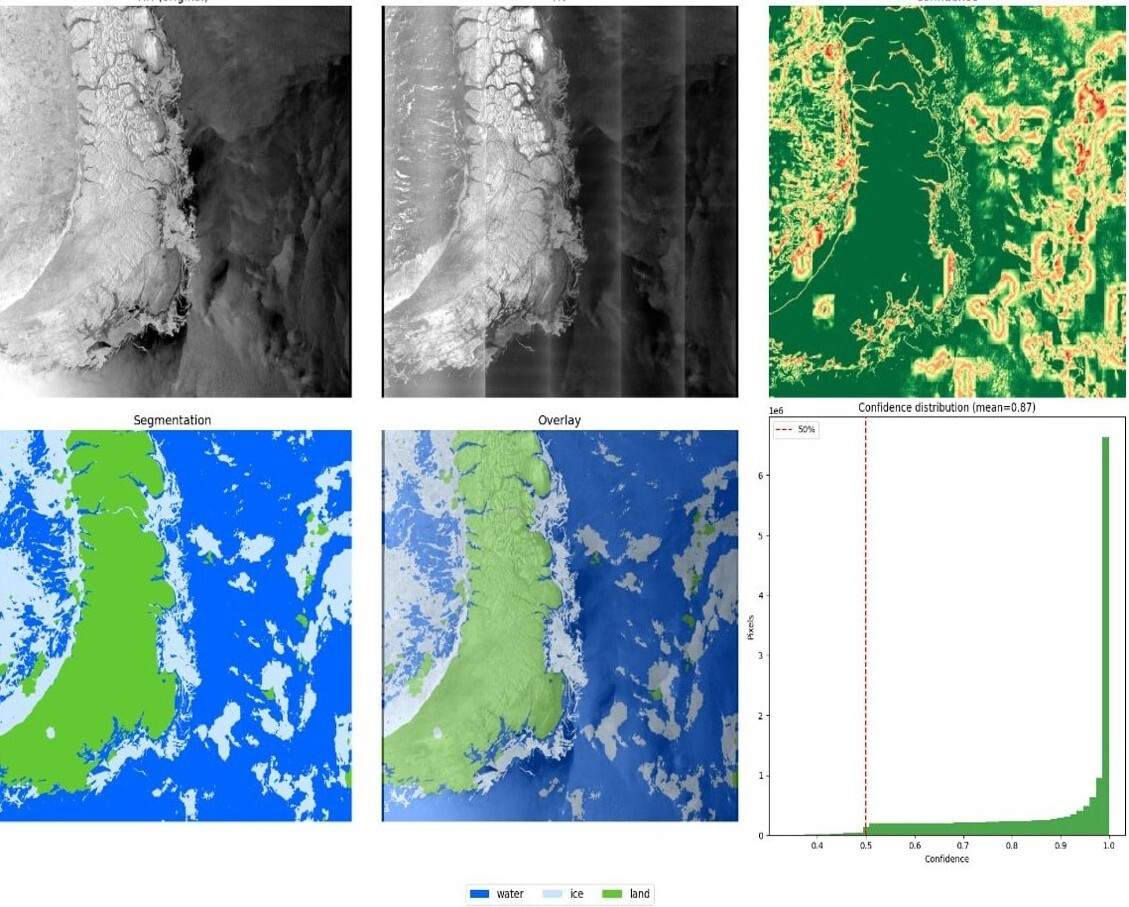
The service monitors Arctic waters using SAR data.
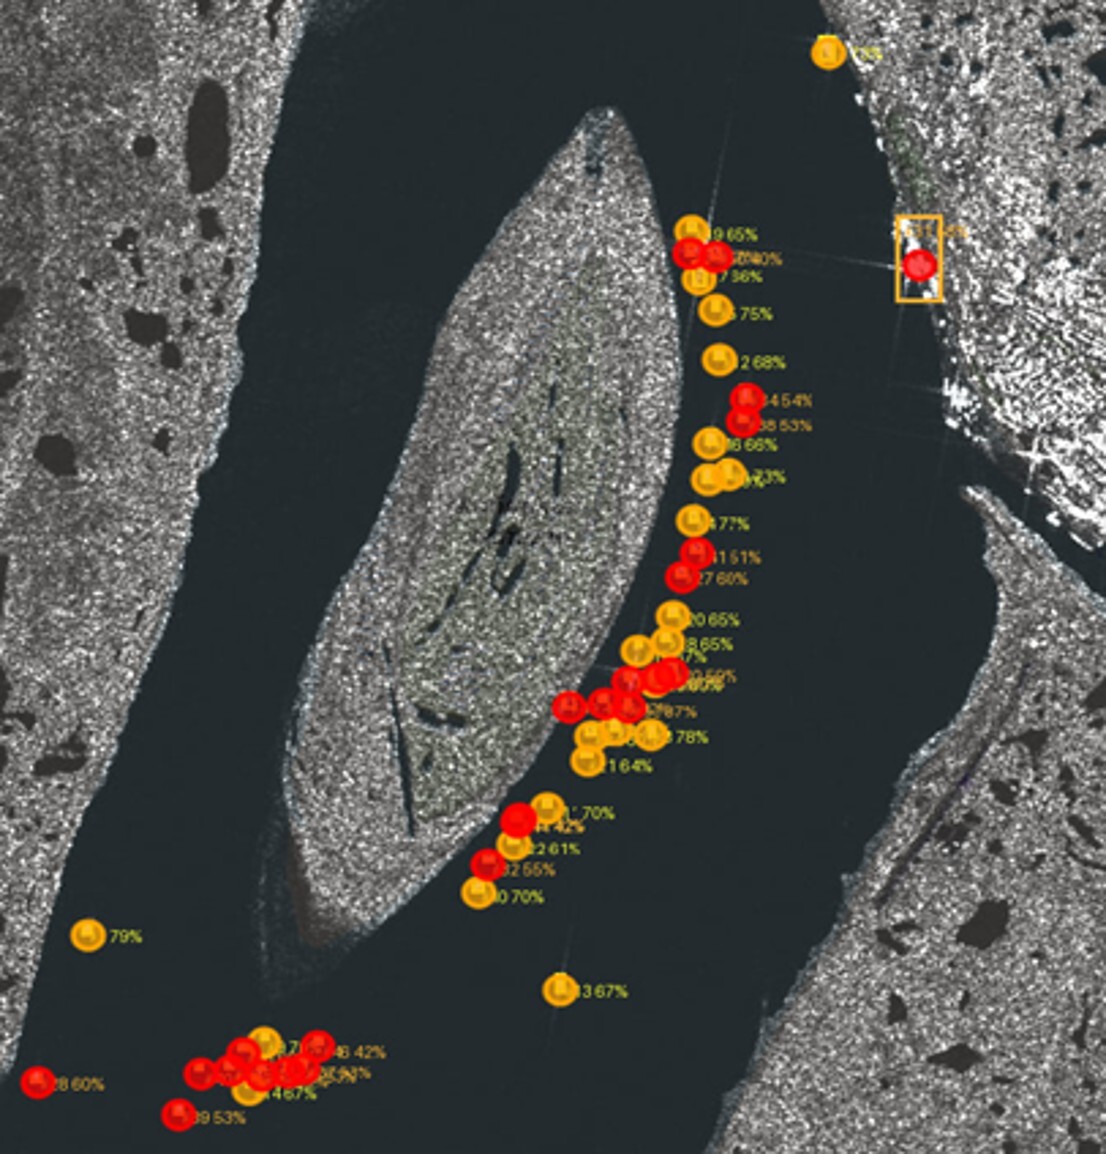
Processing includes assessment of ice conditions; classification of water, ice, and land; vessel detection;
detection of maritime infrastructure; and track analysis.
| Data | SAR imagery for monitoring maritime areas |
| Case-study areas | Arctic seas, ports, approach channels, and routes |
| Applications | ice conditions, vessels, infrastructure, and icebreaker tracks |
| Methods | segmentation, object detection, and track-analysis algorithms |
| Output | situation maps and an analytical report |
- Map of current ice and navigation conditions based on recent SAR data
- Detection of vessels and infrastructure in ports and approach areas
- Detection of icebreaker tracks and assessment of route accessibility
- Analytical report supporting operational planning and safe navigation
Orbital
and ground segment
The radar satellite provides all-weather, round-the-clock imaging.
The ground segment receives, decodes, and processes the data—from the downlink stream to finished L1/L2 products.
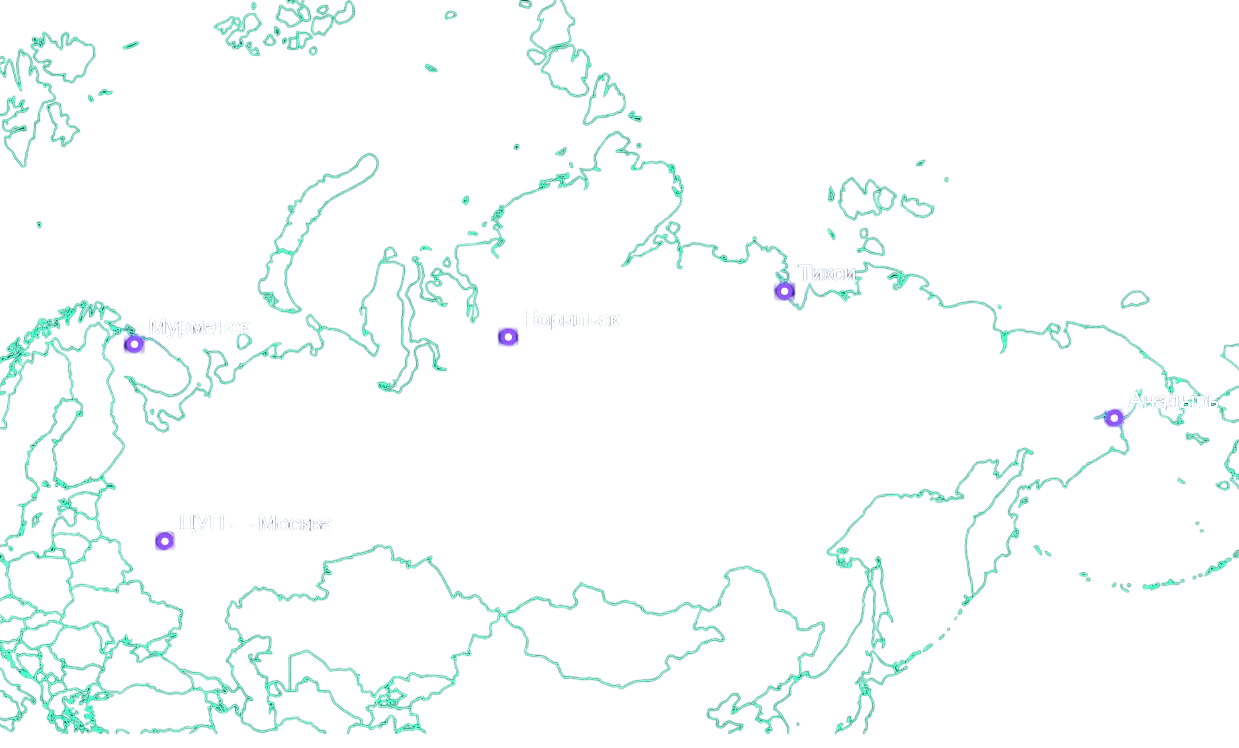
A distributed network of ground receiving stations minimises data delivery latency
for Arctic and remote regions.
Let’s discuss your project
and prepare a cost estimate
Tell us about your infrastructure and requirements—we’ll recommend an integration format and data delivery method.